![]()
Creating and Managing Alarms
V1.1 – December 2023
| Version | Author | Description |
|---|---|---|
| V1.0 – 2023-12-20 | Diogo Hatz 50037923 | Initial Version |
| V1.0 – 2023-12-21 | Wisley da Silva 00830850 | Document Review |
Introduction
Cloud Eye (CES) is a free tool for monitoring Huawei Cloud resources. In addition to resource monitoring, Cloud Eye can also be used to create event- or metric-based alarms, identify resource malfunctions, and quickly react to resource changes. It is worth noting that, although Cloud Eye is a free service, charges for sending notifications when alarms are triggered are charged.
This document aims to describe the main functionalities of the Cloud Eye service and guide the reader to use CES for monitoring cloud resources, such as ECSs, VPNs, and CBRs, etc. In addition, it also describes how to create event- or metric-based alarms and customize dashboards for resource monitoring.
Cloud Eye on the console
Overview
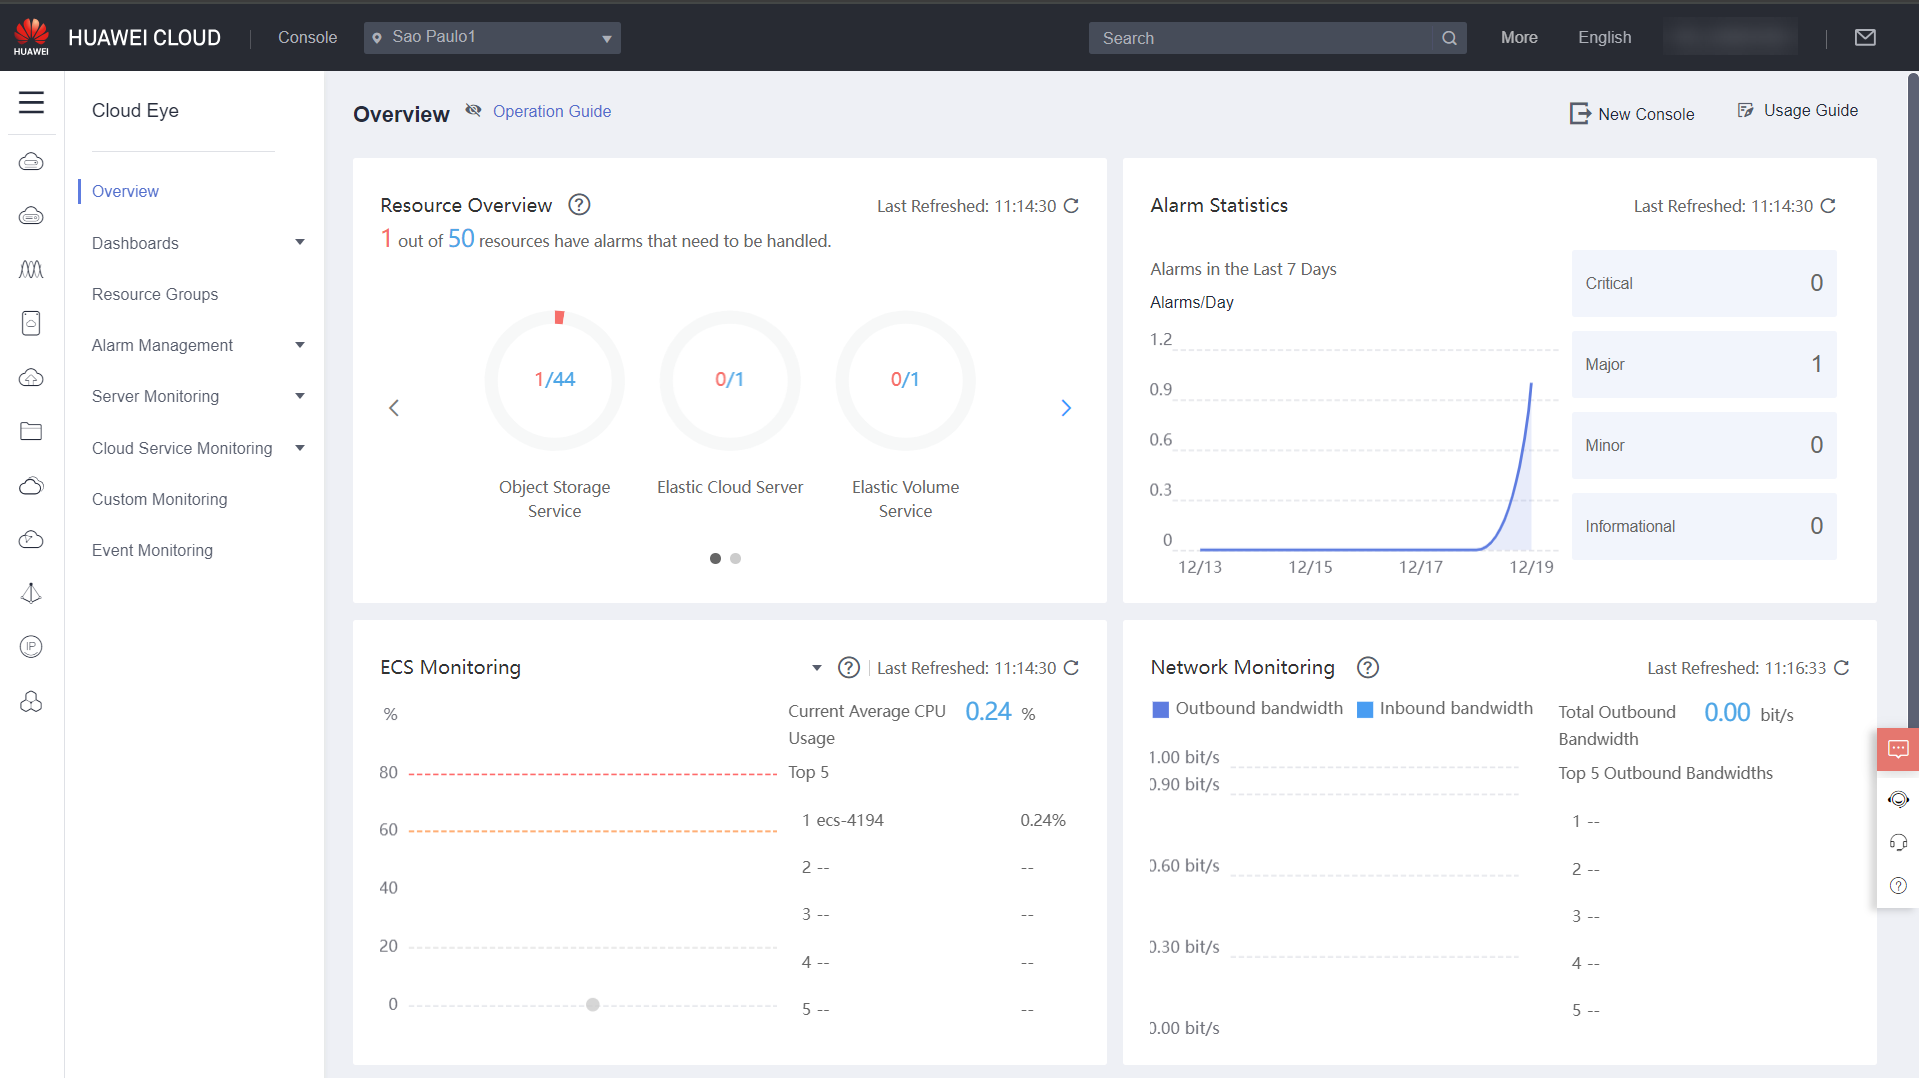
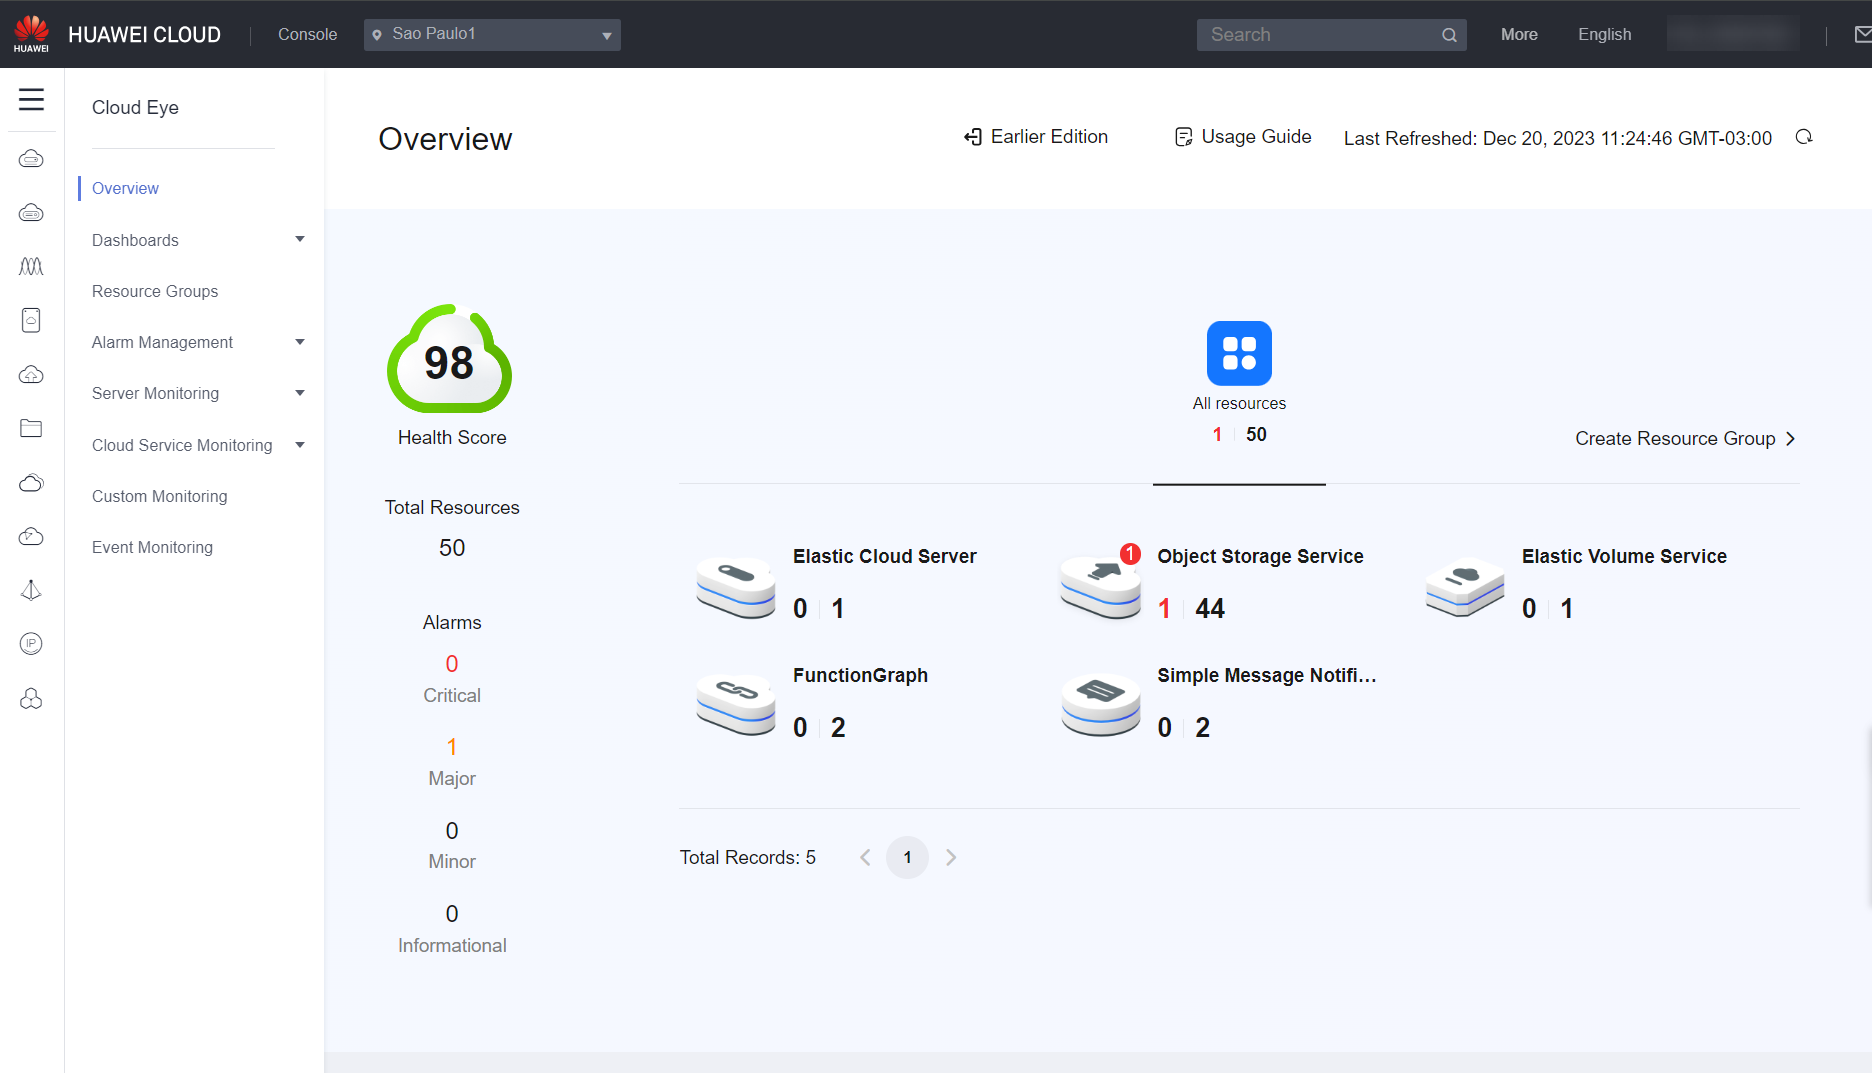
When you open Cloud Eye on the console, the home page that will load is the Overview, where you can see an overview of all resources used in Huawei Cloud, the overall network, CPU, memory, and disk utilization, and which resources have recently triggered alarms and need further attention.
-
Resource Overview: Allows you to view the total number of monitored resources and the alarms generated for these resources.
-
Alarm Statistics: Shows the alarms triggered in the last seven days by alarm severity.
-
Server Monitoring: Allows you to view the overall CPU and memory utilization of monitored servers and a list of the top 5 ECSs ranked by CPU or memory utilization.
-
Network Monitoring: Shows the overall bandwidth utilization of EIPs and a list of the top 5 EIPs ranked by bandwidth utilization.
-
Storage Monitoring: Allows you to view the overall disk utilization (EVS) by read and write IOPS and a list of the top 5 disks ranked by IOPS.
You can see what the Cloud Eye home page looks like in the images below:
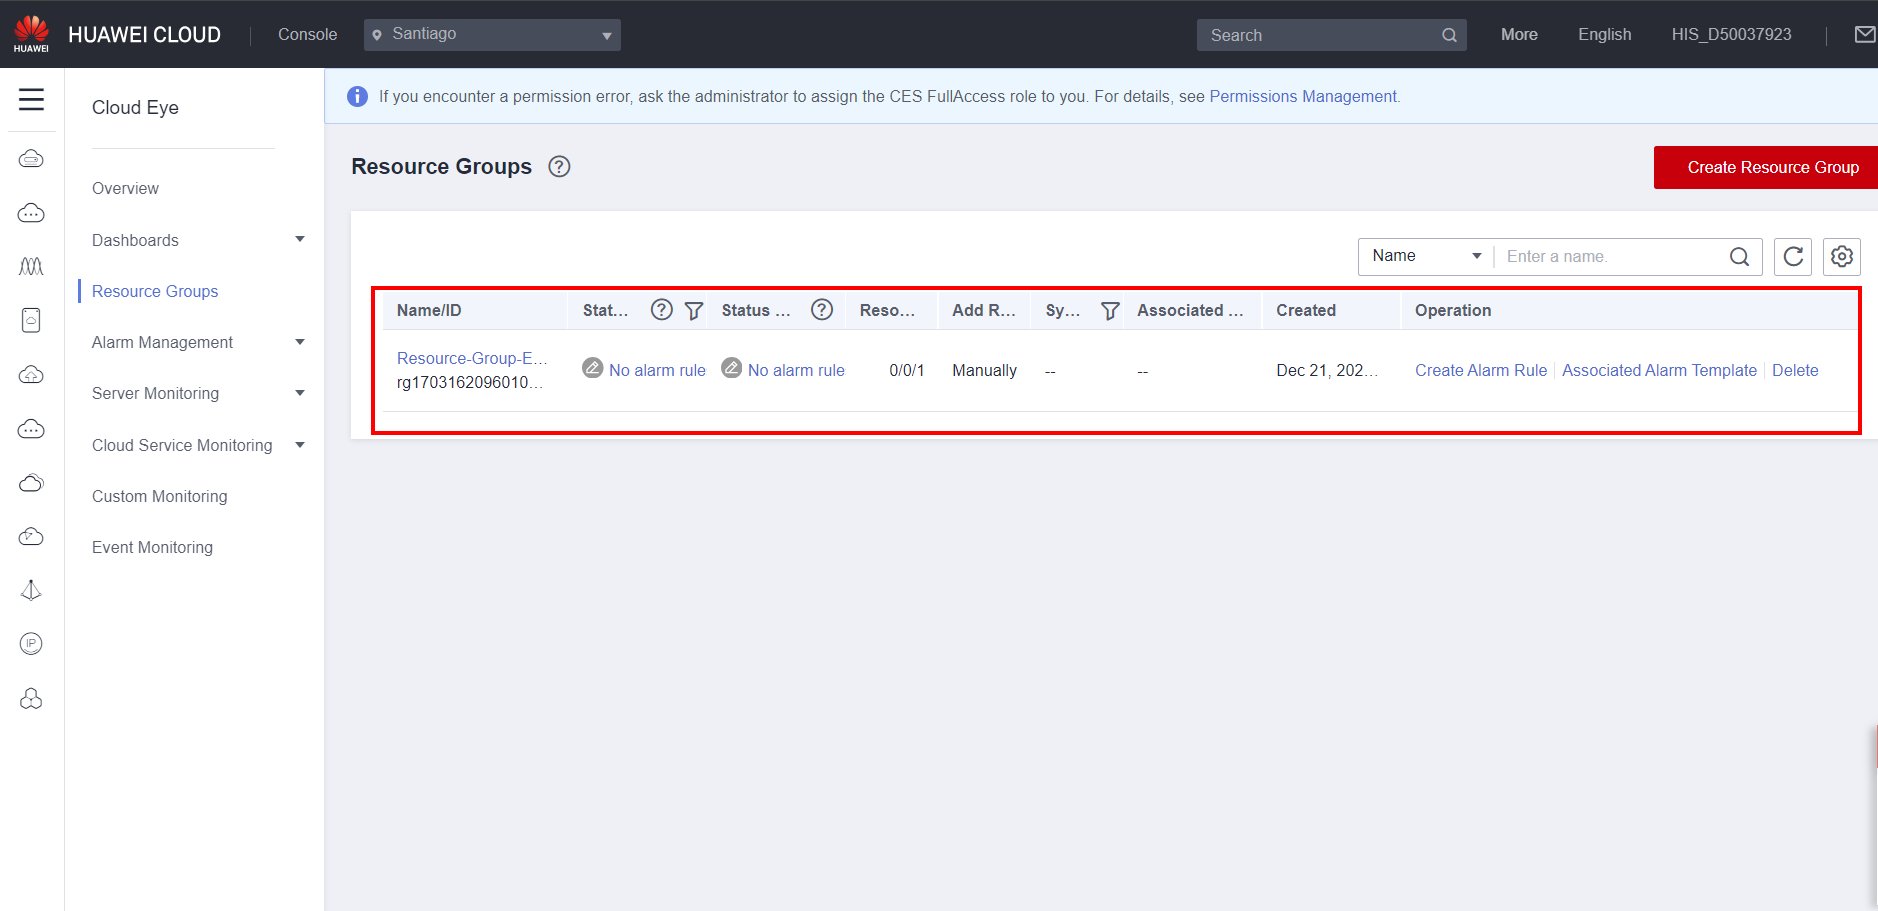
Resource groups
Resource groups allow you to group multiple Huawei Cloud resources for joint monitoring, and also facilitate the management of alarms for multiple resources in batches.
A resource group can be created in the Resource Groups section by clicking Create Resource Group.
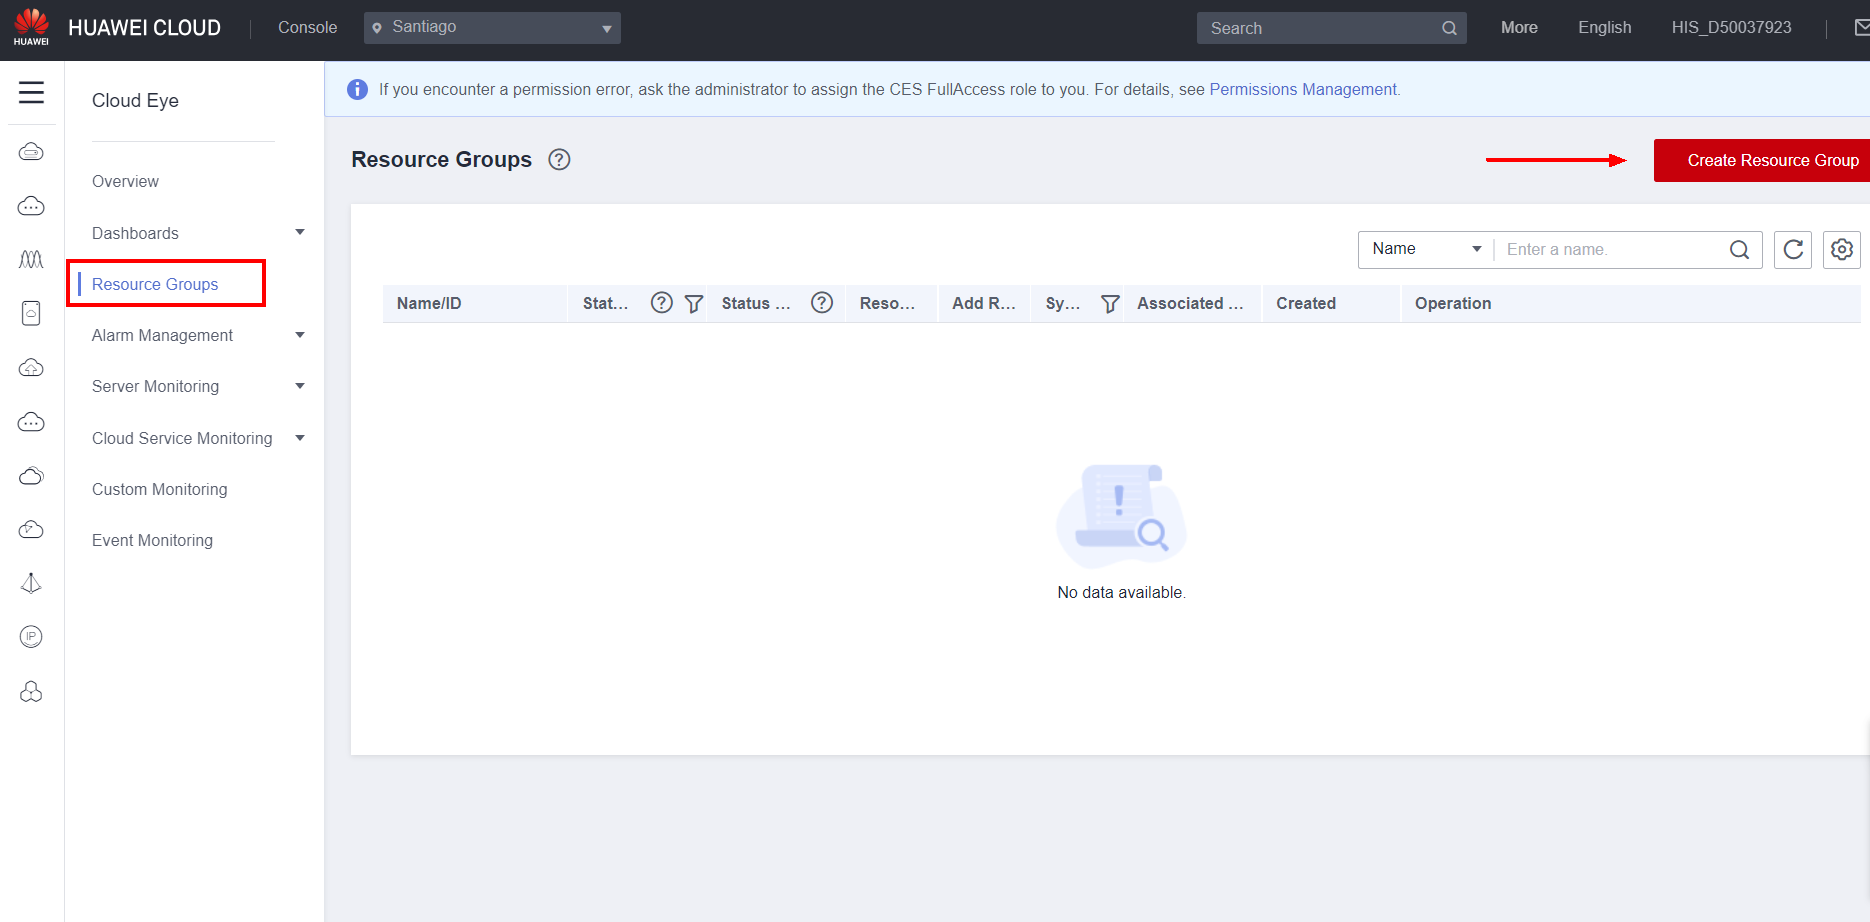
On the page that loads, choose a name for the resource group in Name and select the resources to add to the group by service. After adding all the desired resources, click Create.
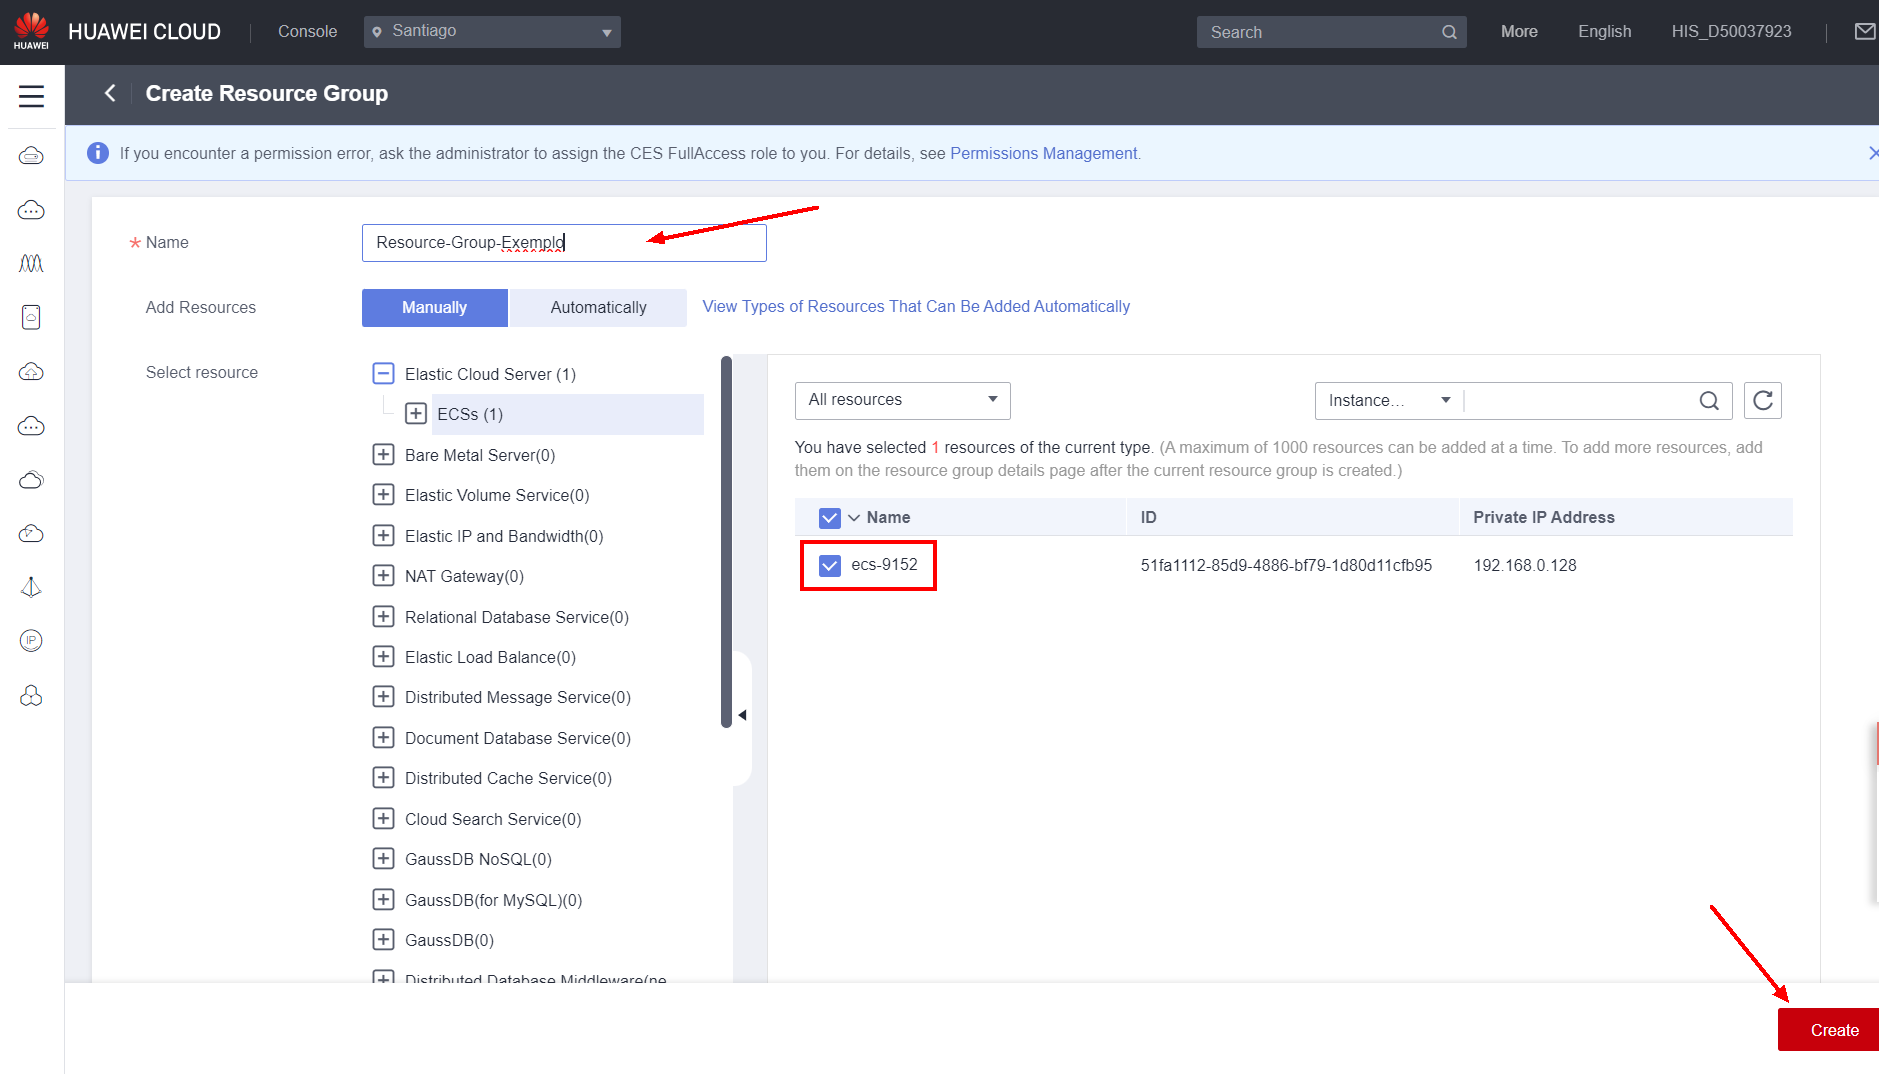
You can create alarms for a specific resource group, making it easy to create batch alarms for multiple resources that share the same context.
Alarm management
The alarm management section has the following subsections:
-
Alarm rules: Subsection used to view and create alarms based on metrics or events.
-
Alarm history: Subsection used to view triggered alarms.
-
Alarm template: Subsection related to viewing alarm templates.
-
One-click monitoring: Subsection that allows you to enable monitoring for common service events
-
Alarm mask: Subsection that allows you to create alarm masks so that triggered alarms are not notified.
Creating an alarm
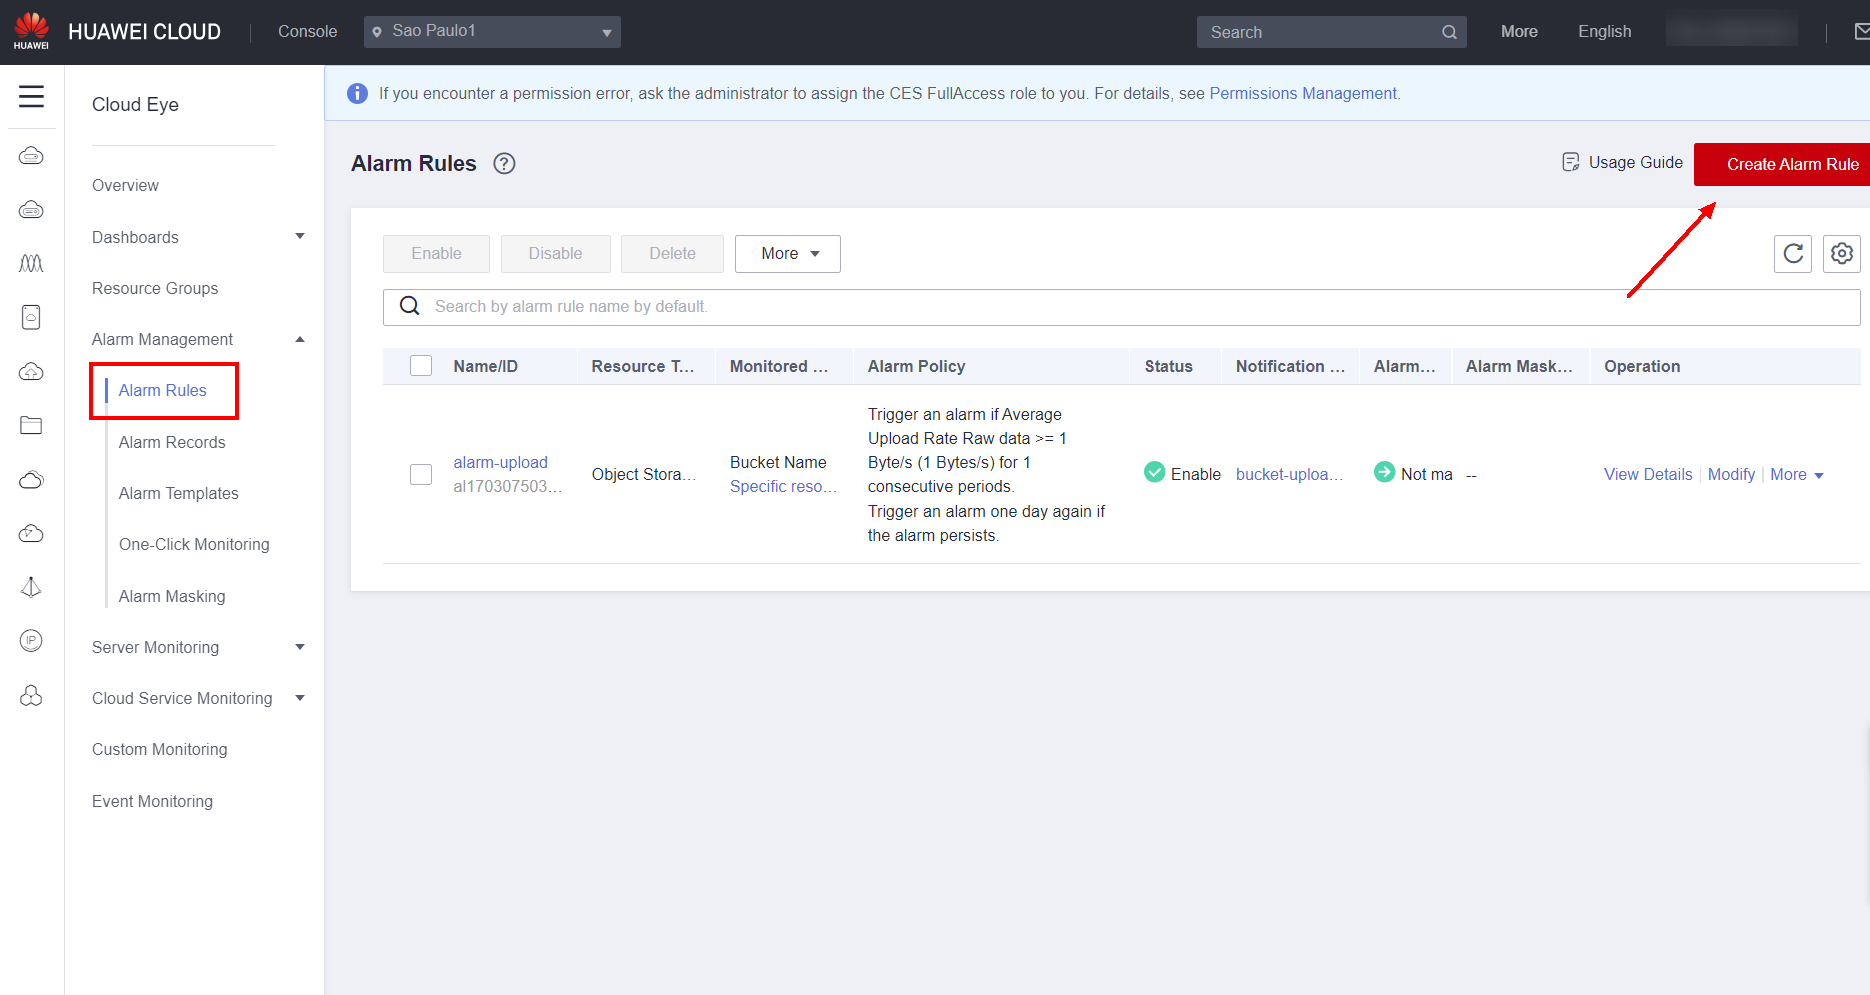
To create an alarm for a specific resource based on an event or metric, navigate to the Alarm Rules section in Alarm Management and click Create Alarm Rule.
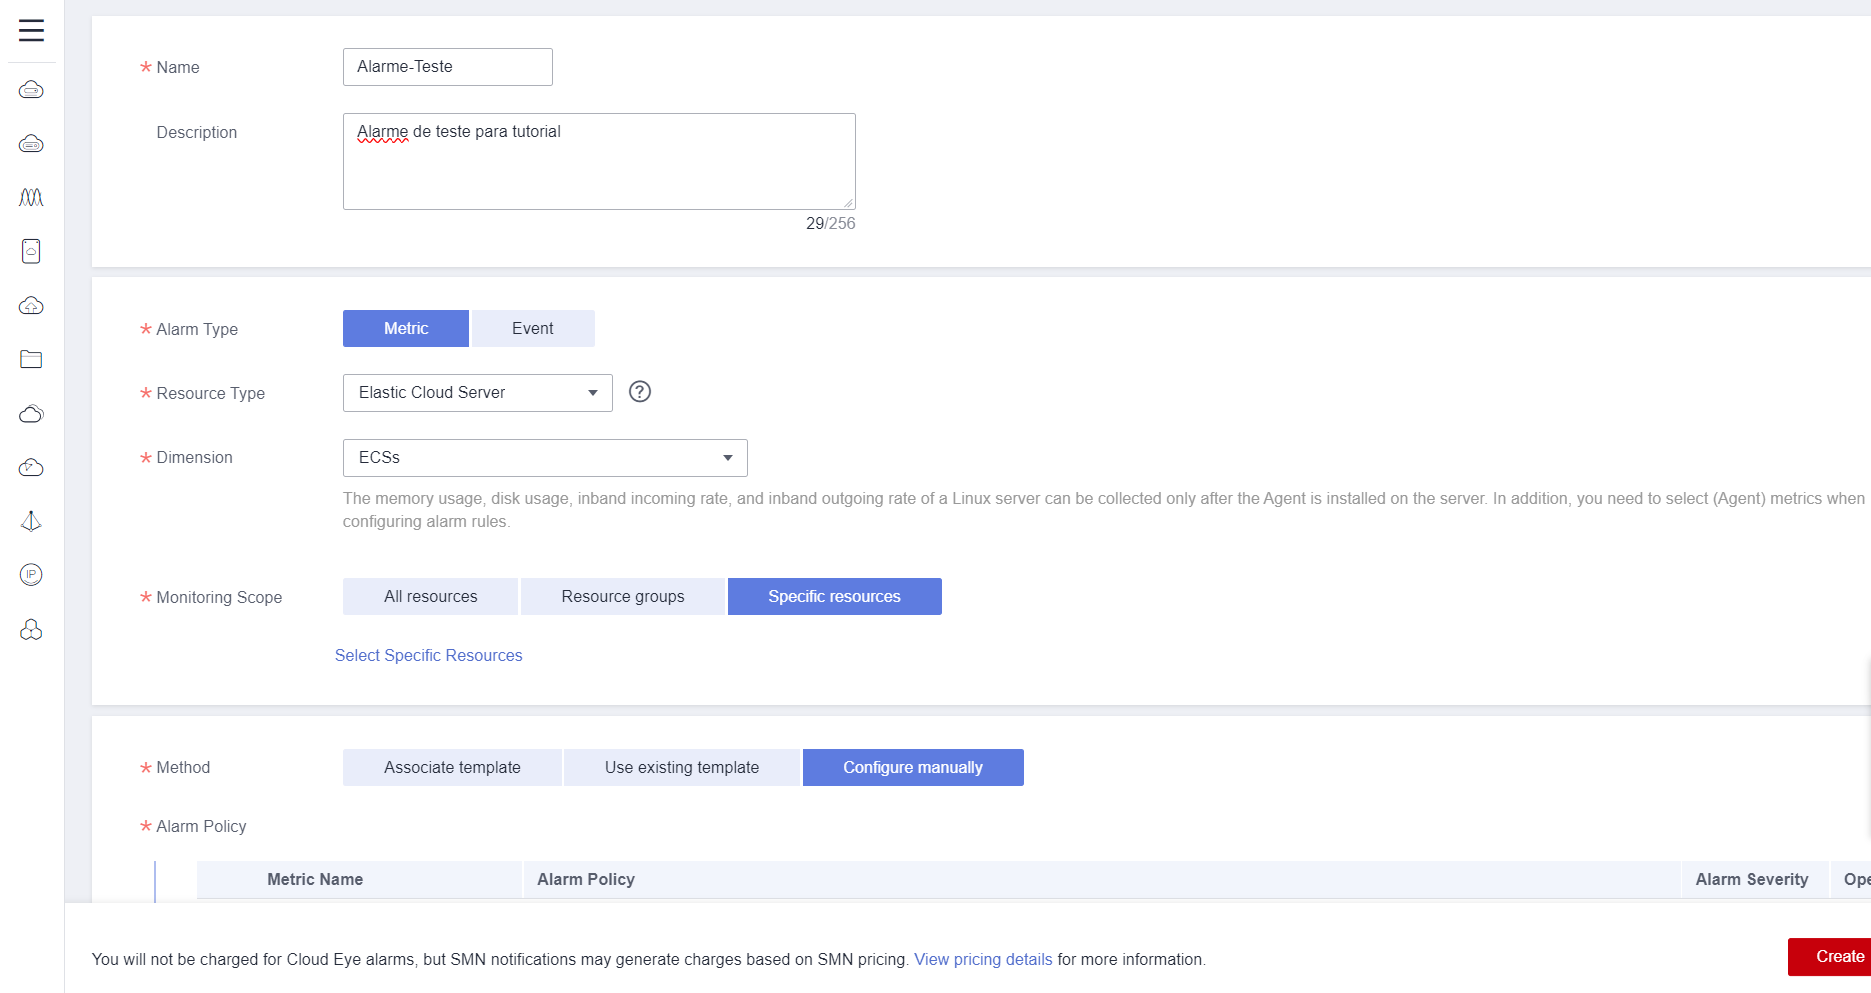
Configure the basic alarm settings, such as the alarm name in Name and the type of resource to be monitored in Resource Type, as well as its scope in Dimension. To configure an alarm for an ECS, for example, the Resource Type is Elastic Cloud Server and the Dimension is ECSs.
If the alarm triggering condition is a metric, such as the ECS CPU or memory utilization rate, select Metric in Alarm Type. If the alarm triggering condition is an event, for example, the event of an uninstalled GPU, select Event in the Alarm Type field. In this example, the metric to trigger the alarm will be the ECS CPU utilization above 80%.
In Monitoring Scope, the specific resource that will trigger the alarm must be configured. The resource can be selected in three different ways:
- All resources: Select this option if the alarm can be triggered by all instances of the selected resource.
- Resource groups: Select this option if the alarm can be triggered by all resources present in a resource group. See section 3.3.
- Specific resources: Select this option to choose a specific instance of the selected service to trigger the alarm.
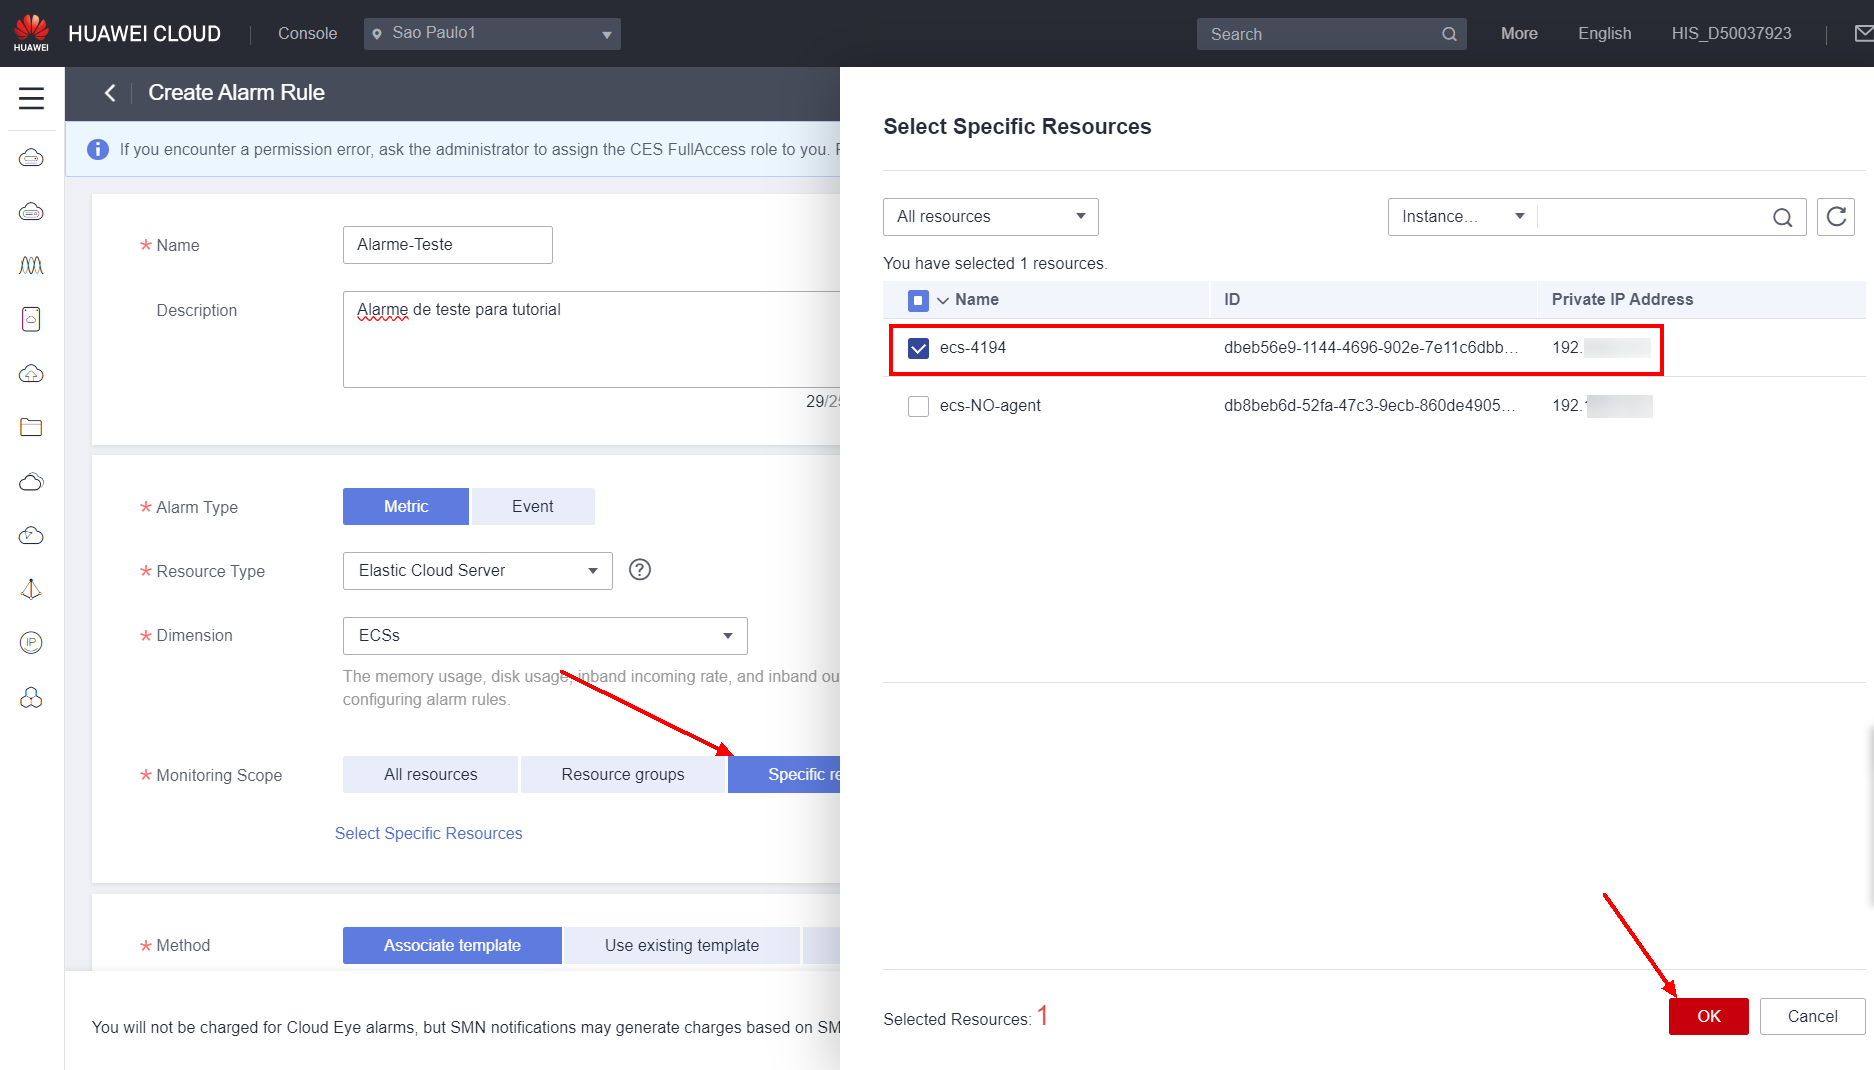
In this example, the ECS “ecs-4194” will be selected as the instance that can trigger the alarm in the Specific resources field under Monitoring Scope.
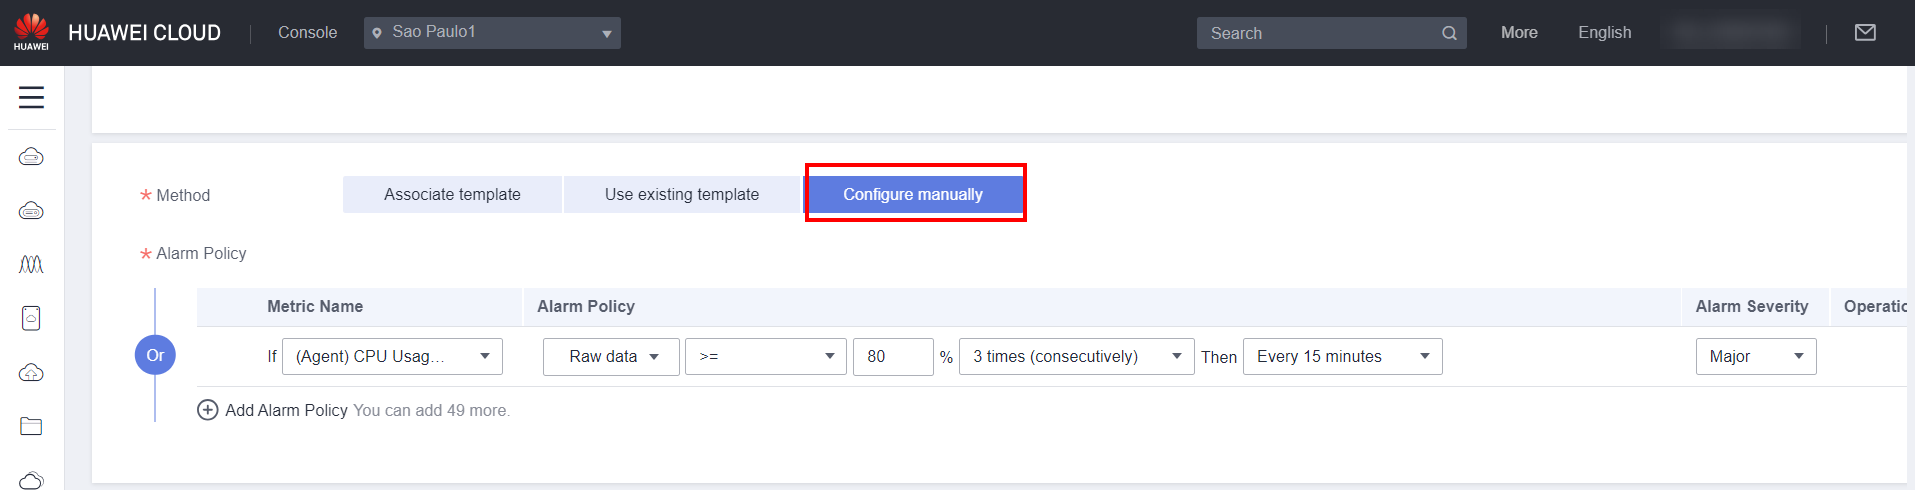
There are three different ways to configure the metric that will trigger the alarm in Method:
-
Associate template: In this option, the metric to trigger the alarm will be configured based on an existing template.
-
Use existing template: In this option, the metric to trigger the alarm will be configured based on an existing template.
-
Configure manually: In this option, the metric to trigger the alarm will be configured manually, which allows for greater flexibility.
In this example, the metric that will be configured to trigger the alarm will be if the ECS CPU usage is greater than or equal to 80%. In Metric Name, it is possible to select the metric that can trigger the alarm, as in this case it is (Agent) CPU Usage (Recommended). For this option to be selected, the Cloud Eye agent must be installed, as done in section 3.5. It is important that the agent is installed on monitored servers to obtain better accuracy in data monitoring and a wider range of monitoring metrics.
In Alarm Policy, you can select the type of data that will be analyzed, such as raw data, average, maximum, minimum, variance or sum of the ingested data; as well as the percentage that will trigger the alarm and the form of comparison, such as greater than or equal, greater than, less than, less than or equal, increase in relation to or decrease in relation to.
In the Alarm Notification section, you can configure a notification for alarms triggered by email, SMS, HTTP and HTTPS requests or through a trigger in FunctionGraph. If the notification only needs to be sent to the email of the account owner in the Huawei Cloud console, you can select the Account contact option in Notification Object directly. In this example, a second email address will be configured to receive notifications of Cloud Eye alarms. To do this, you must first enable the Short Message Notification (SMN) service. 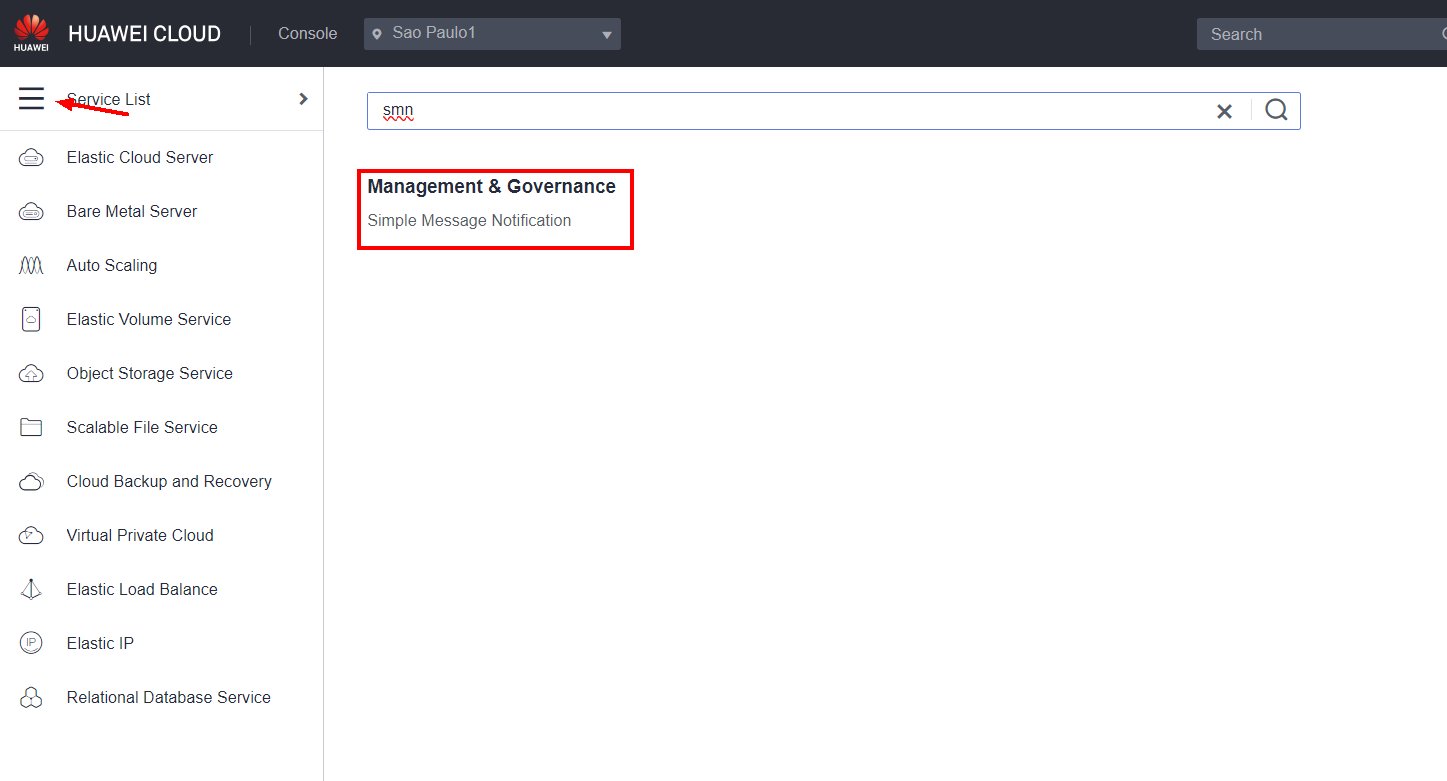 Click Topics to view the notification topics that you have created.
 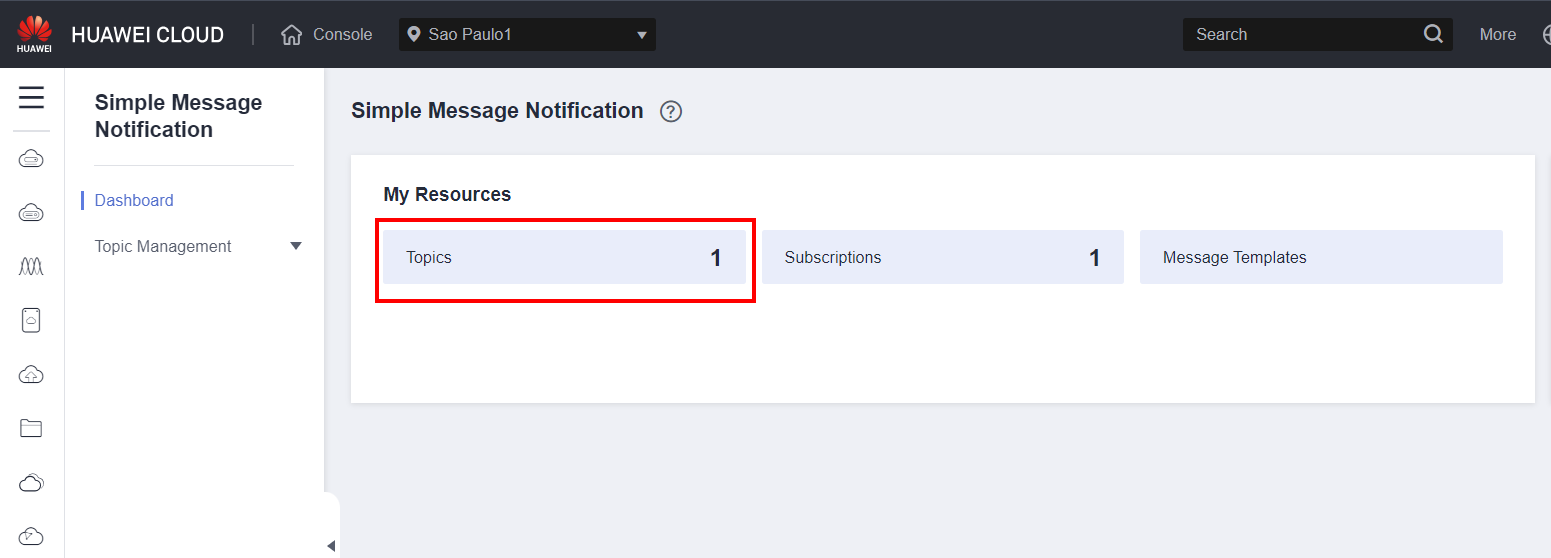 Click Create Topic to create a notification topic.
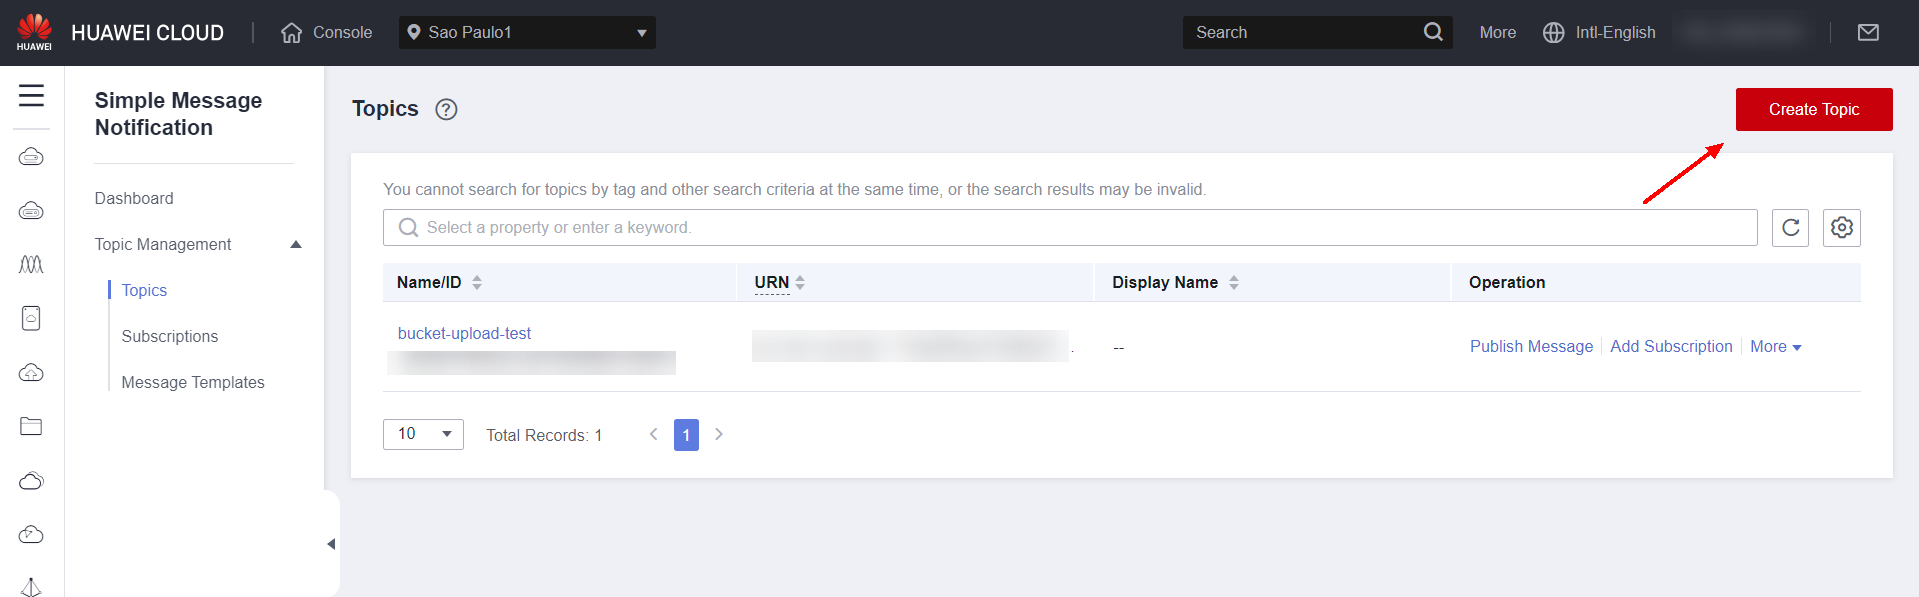
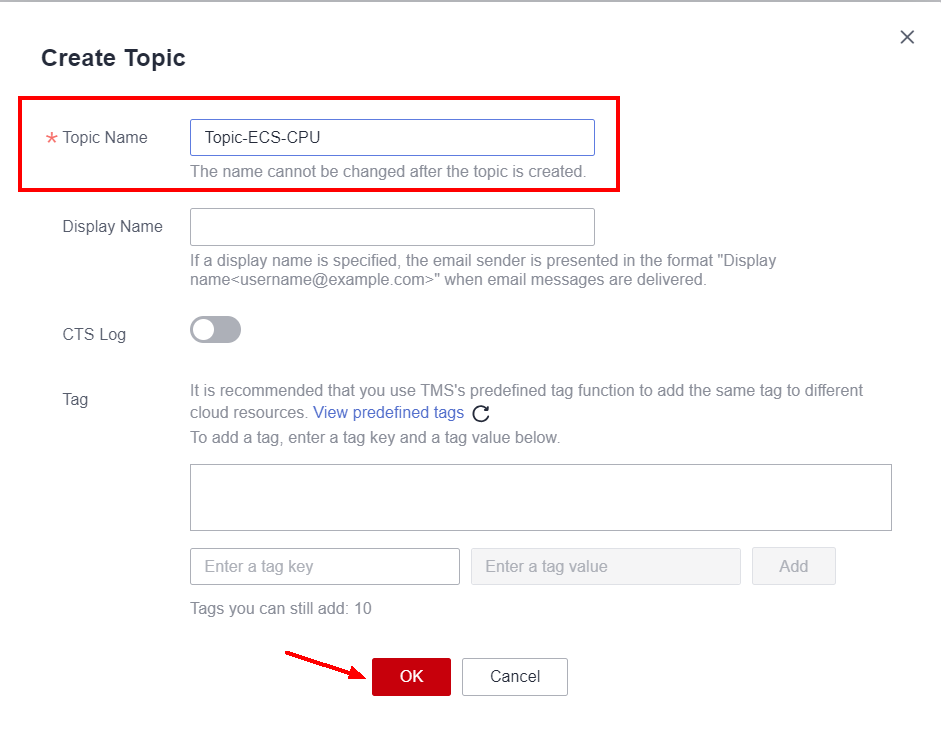
Enter the name of the notification topic in Topic Name and click OK.
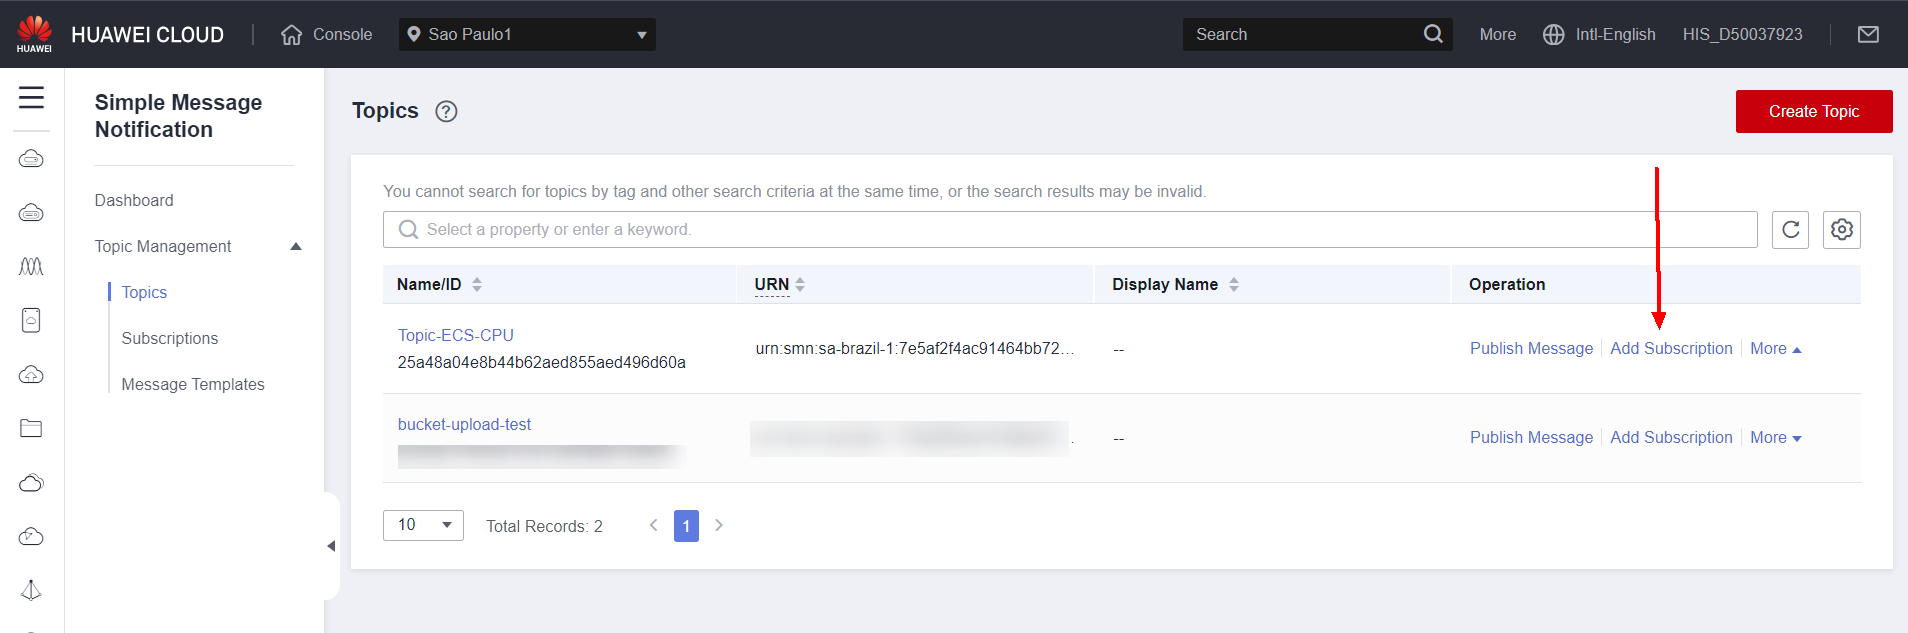
Next, click Add Subscription to add a communication channel through which the notification will be sent.
Next, choose the protocol for sending the notification, in this case Email, and enter the chosen email in Endpoints. Click OK.
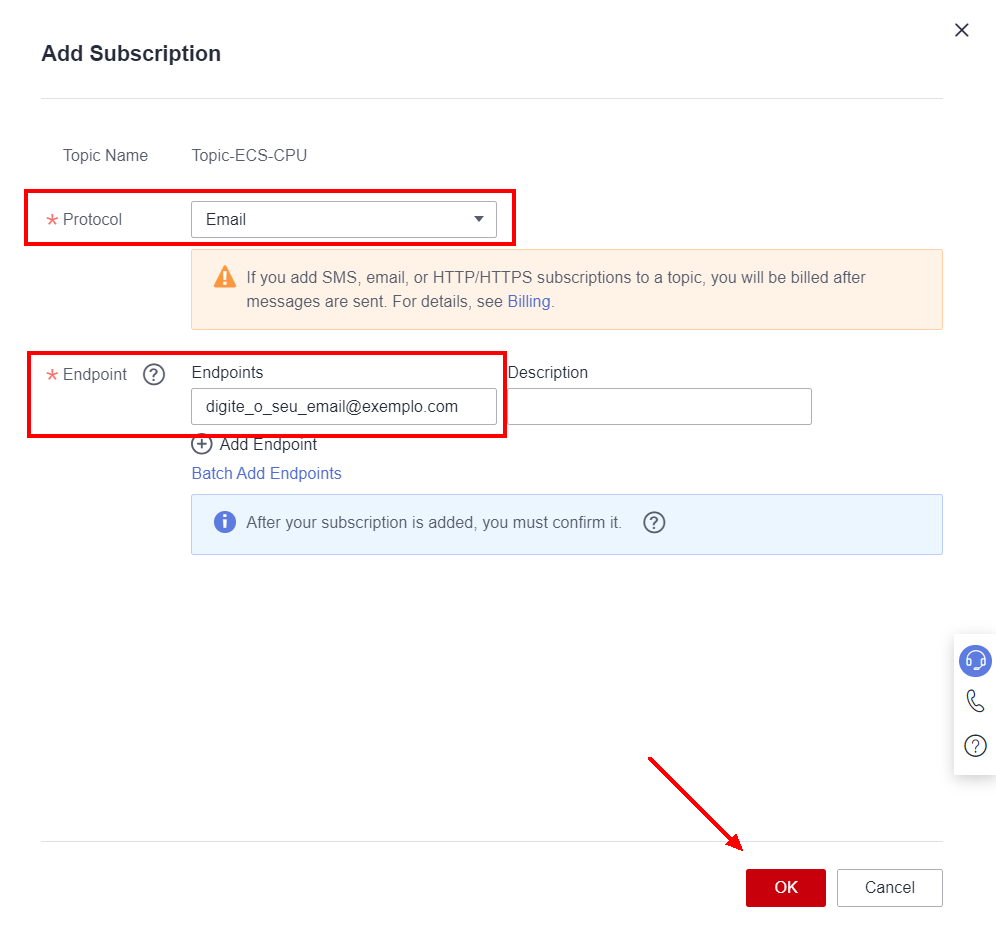
An email will be sent to the selected endpoint. For the SMN service to work correctly, the user must confirm their email through a confirmation that will be sent as soon as the Subscription is configured.
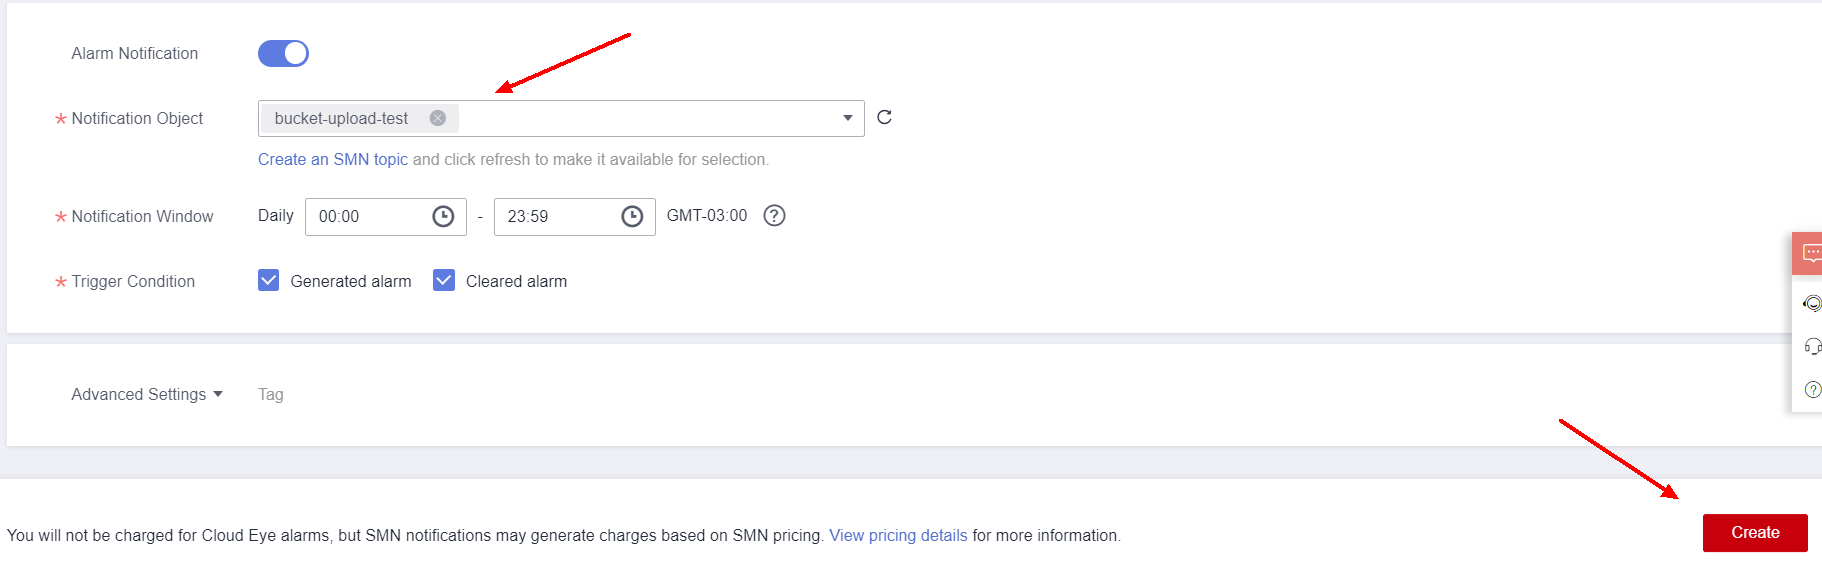
Returning to the alarm creation, select the topic created in the previous steps in Notification Object and configure the time window in which the notification can be sent in Notification Window.
In addition, also select the occasions in which the notification will be sent in the Trigger Condition: when the alarm is generated or when the alarm is cleared. After configuring, select Create to create the alarm.
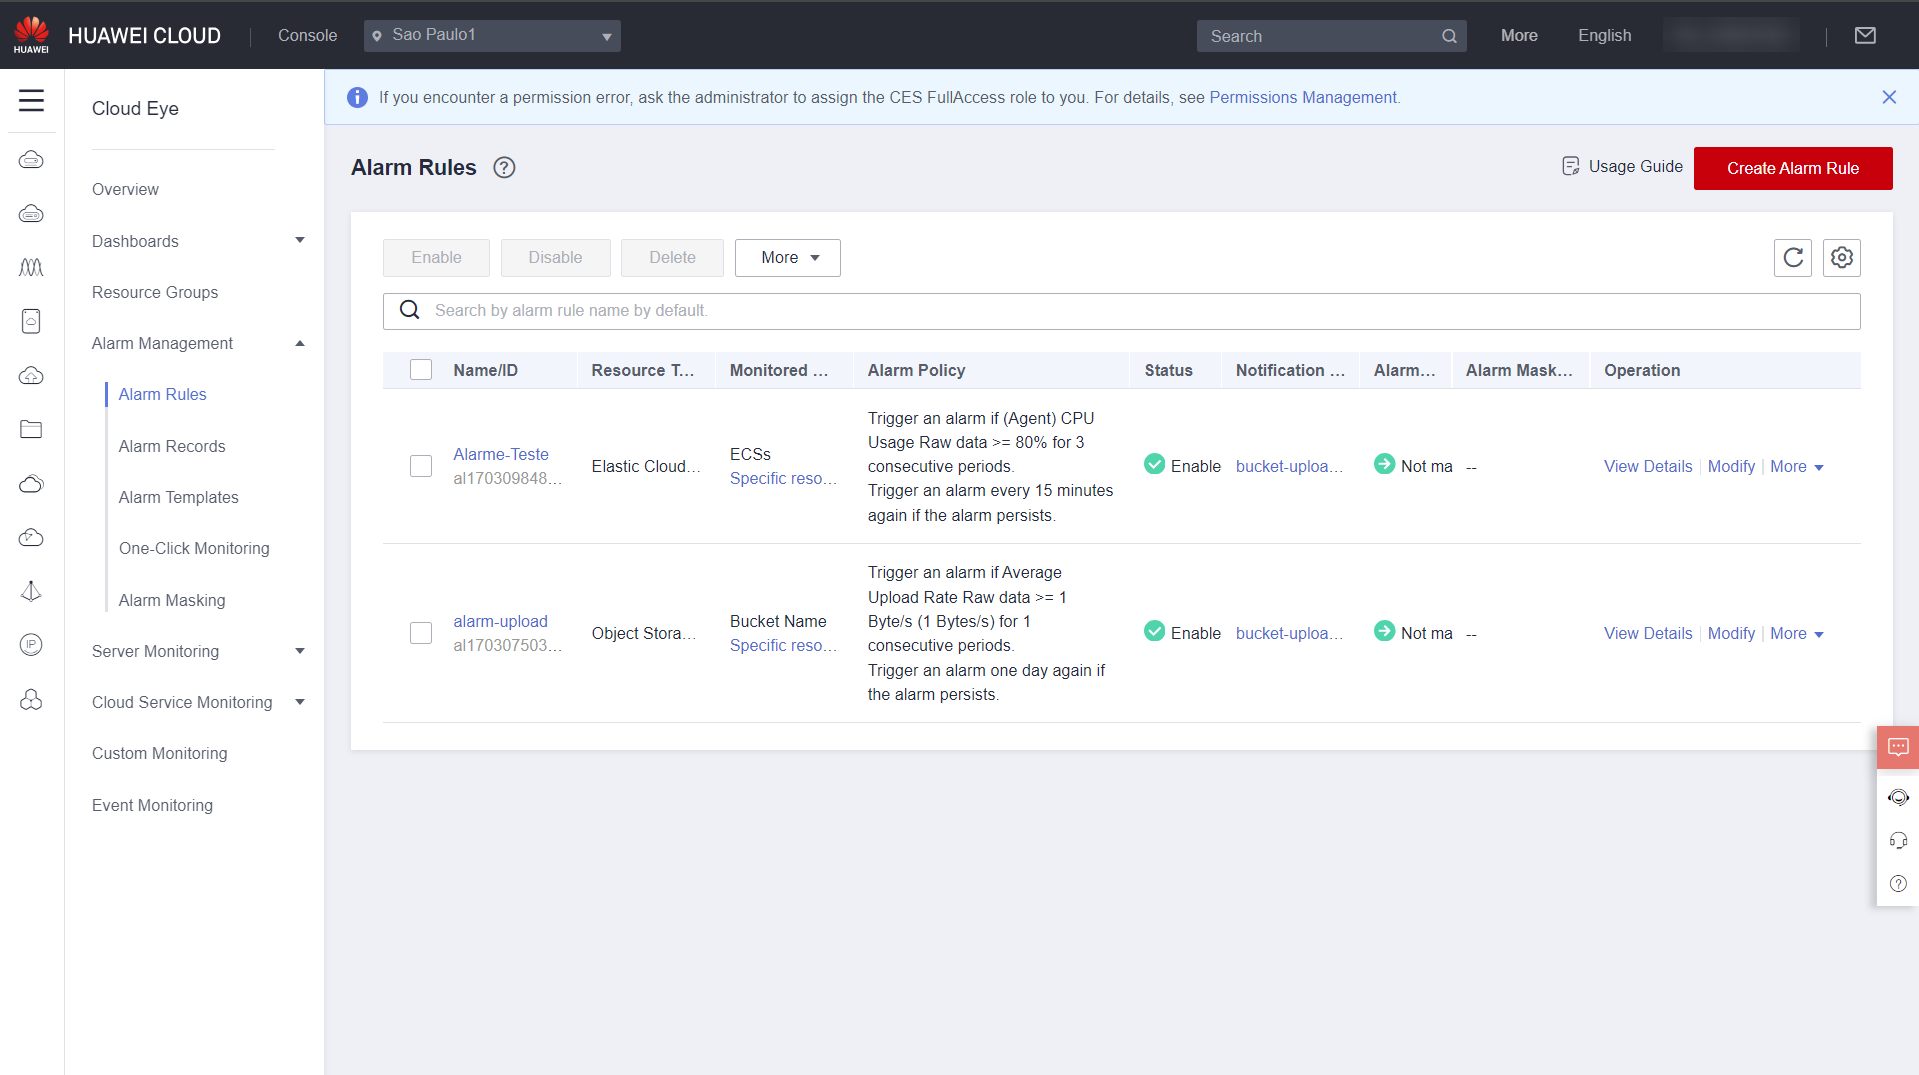
In Alarm Rules you can see the created alarms and their statuses, as well as the resource that is monitored and the alarm activation policy.
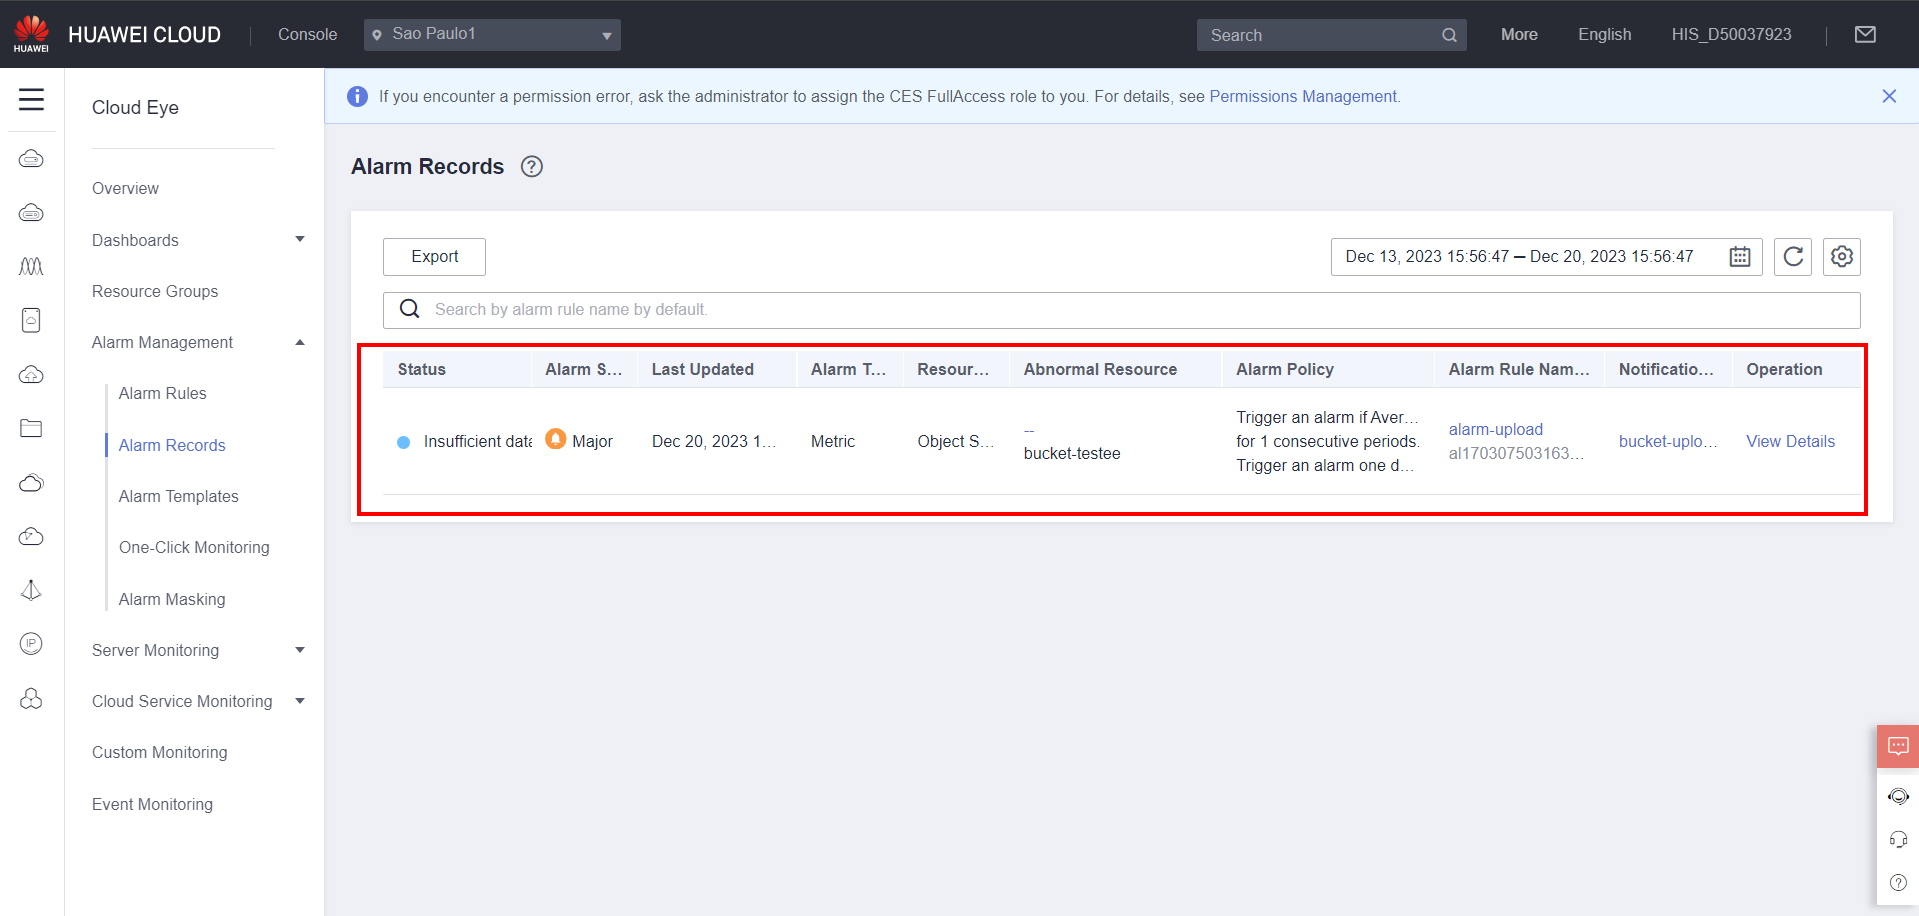
After an alarm is triggered, you can view it in the Alarm Records section in Alarm Management.
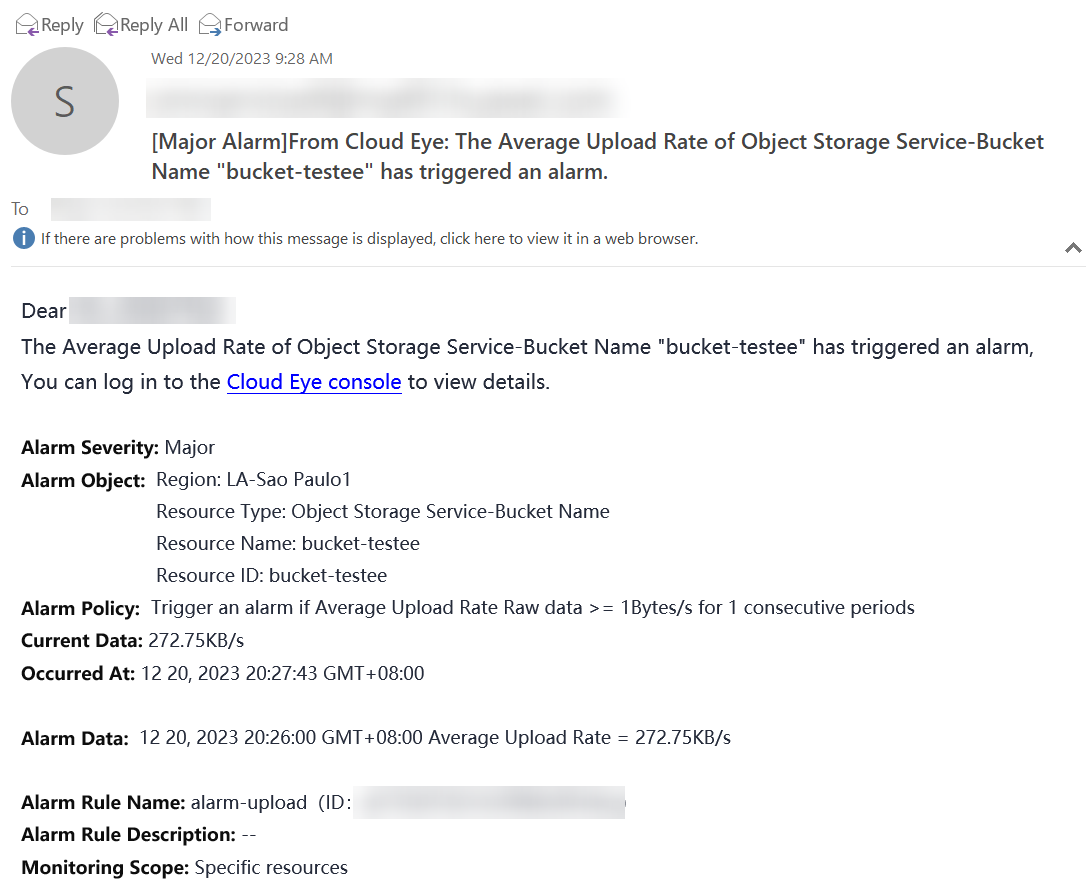
You can also view the notification generated by the alarm on the endpoint selected for sending the notification in the SMN service. In another context, the following email was generated for monitoring a bucket in the OBS service for object storage in Huawei Cloud:
The tables for the metrics and events monitored for Huawei Cloud ECS, VPN, NAT, and CBR services have been included in the appendices section 4.0 of this document. To create event-based alarms or metrics for these services, the procedure is the same as that described above.
Attachments
Server Monitoring Metrics
| Metrics | No Agent | Agent Installed |
|---|---|---|
| CPU Usage | Yes | Yes / Dedicated |
| Disk Usage | Yes | Yes |
| Memory Usage | Yes | Yes / Dedicated |
| Disk Write Bandwidth | Yes | Yes |
| Disk Read Bandwidth | Yes | Yes |
| Disk Write IOPS | Yes | Yes |
| Disk Read IOPS | Yes | Yes |
| In-Band Rate | Yes | Yes |
| In-Band Rate | Yes | Yes |
| In-Band Rate | Yes | Yes |
| Out-Band Rate | Yes | Yes |
| Out-Band Rate | Yes | Yes |
| CPU Credit Usage | Yes | Yes |
| CPU Credit Balancing | Yes | Yes |
| CPU Credit Balancing Overage | Yes | Yes |
| CPU Loaded Credit Overage | Yes | Yes |
| Network Connections | Yes | Yes |
| Inbound Bandwidth Per Server | Yes | Yes |
| Outbound Bandwidth Per Server | Yes | Yes |
| Inbound PPS | Yes | Yes |
| Outbound PPS | Yes | Yes |
| New Connections | Yes | Yes |
| Aggregate ECC Uncorrectable Errors | Yes | Yes |
| Pages Retired with Single Bit Errors | Yes | Yes |
| Pages Retired with Double Bit Errors | Yes | Yes |
| GPU Health Status | Yes | Yes |
| GPU Encoder Usage | Yes | Yes |
| GPU Decoder Usage | Yes | Yes |
| ECC Volatile Correctable Errors | Yes | Yes |
| ECC Volatile Uncorrectable Errors | Yes | Yes |
| CPU Idle | No | Yes / Dedicated |
| User space CPU usage | No | Yes / Dedicated |
| Kernel space CPU usage | No | Yes / Dedicated |
| Other processes CPU usage | No | Yes / Dedicated |
| Optimal processes CPU usage | No | Yes / Dedicated |
| Time the CPU is waiting for I/O operations | No | Yes / Dedicated |
| CPU interrupt time | No | Yes / Dedicated |
| Software CPU interrupt time | No | Yes / Dedicated |
| Available memory | No | Yes / Dedicated |
| Idle memory | No | Yes / Dedicated |
| Buffer | No | Yes / Dedicated |
| Cache | No | Yes / Dedicated |
| Input bandwidth per NIC | No | Yes / Dedicated |
| Output bandwidth per NIC | No | Yes / Dedicated |
| Packet rate sent per NIC | No | Yes / Dedicated |
| Packet rate received per NIC | No | Yes / Dedicated |
| Error packet rate received per NIC | No | Yes / Dedicated |
| Error packet rate transmitted per NIC | No | Yes / Dedicated |
| Received packets dropped rate per NIC | No | Yes / Dedicated |
| Transmitted packets dropped rate per NIC | No | Yes / Dedicated |
| Running processes | No | Yes / Dedicated |
| Idle processes | No | Yes / Dedicated |
| Zombie processes | No | Yes / Dedicated |
| Blocked processes | No | Yes / Dedicated |
| Sleeping processes | No | Yes / Dedicated |
| Total processes | No | Yes / Dedicated |
| TCP retransmission rate | No | Yes / Dedicated |
| TCP SYS_SENT | No | Yes / Dedicated |
| TCP SYS_RECV | No | Yes / Dedicated |
| TCP FIN_WAIT1 | No | Yes / Dedicated |
| TCP FIN_WAIT2 | No | Yes / Dedicated |
| TCP CLOSE | No | Yes / Dedicated |
| TCP LAST_ACK | No | Yes / Dedicated |
| TCP LISTEN | No | Yes / Dedicated |
| TCP CLOSING | No | Yes / Dedicated |
| Average CPU load in the last minute | No | Yes / Dedicated |
| Average CPU load in the last 15 minutes | No | Yes / Dedicated |
| Average CPU load in the last 5 minutes | No | Yes / Dedicated |
| TCP ESTABLISHED | No | Yes / Dedicated |
| TCP TOTAL | No | Yes / Dedicated |
| UDP TOTAL | No | Yes / Dedicated |
| NTP Offset | No | Yes / Dedicated |
| Total files processed | No | Yes / Dedicated |
VPN Gateway Monitoring Metrics
| Metrics | Supported |
|---|---|
| Ingress Packet Rate | Yes |
| Egress Packet Rate | Yes |
| Ingress Bandwidth | Yes |
| Egress Bandwidth | Yes |
| Ingress Bandwidth Usage | Yes |
| Number of Connections | Yes |
| Egress Bandwidth Usage | Yes |
VPN Connection Monitoring Metrics
| Metrics | Supported |
|---|---|
| Tunnel Average RTT | Yes |
| Tunnel Max RTT | Yes |
| Tunnel Packet Loss Rate | Yes |
| Link Average RTT | Yes |
| Link Max RTT | Yes |
| Link Packet Loss Rate | Yes |
| VPN Connection Status | Yes |
| Packet Receive Rate | Yes |
| Packet Send Rate | Yes |
| Traffic Receive Rate | Yes |
| Traffic Send Rate | Yes |
| SA packet sending rate | Yes |
| SA packet receiving rate | Yes |
| SA traffic sending rate | Yes |
| SA traffic receiving rate | Yes |
NAT monitoring metrics
| Metrics | Supported |
|---|---|
| SNAT connections | Yes |
| Inbound bandwidth | Yes |
| Outbound bandwidth | Yes |
| Inbound PPS | Yes |
| Outbound PPS | Yes |
| Inbound traffic | Yes |
| Outbound traffic | Yes |
| SNAT connections usage rate | Yes |
| Inbound bandwidth usage rate | Yes |
| Outbound bandwidth usage rate | Yes |
| Total outbound bandwidth (UDP) | Yes |
| Total outbound bandwidth (TCP) | Yes |
| Total inbound bandwidth (UDP) | Yes |
| Total inbound bandwidth (TCP) | Yes |
| Packets lost due to excessive SNAT connections | Yes |
| Packets lost due to excessive PPS | Yes |
| Packets lost by all allocated EIP ports | Yes |
Events monitored for CBR alarm
| Events | Supported |
|---|---|
| Agent online | Yes |
| Agent offline | Yes |
| Failed to create backup | Yes |
| Failed to restore resource from backup | Yes |
| Failed to delete backup | Yes |
| Failed to delete vault | Yes |
| Backup was successful | Yes |
| Restore resource from backup was successful | Yes |
| Backup was deleted successfully | Yes |
| Vault was deleted successfully | Yes |
| Error during replication | Yes |
| Replication was successful | Yes |
Events monitored for server alarms
| Events | Supported |
|---|---|
| Redeployment scheduled to be authorized | Yes |
| Local disk swap canceled | Yes |
| Local disk swap to be executed | Yes |
| Xid event alarm triggered on GPU | Yes |
| Spec modification scheduled to be executed | Yes |
| Migration scheduled to be executed | Yes |
| Shutdown scheduled to be executed | Yes |
| Reboot scheduled to be executed | Yes |
| Redeployment scheduled to be executed | Yes |
| Unrecoverable ECC errors generated by GPU SRAM | Yes |
| Inforom alarm generated on GPU | Yes |
| ECC double bit alarm generated on GPU | Yes |
| Excessive retired pages | Yes |
| ECC alarm generated on GPU a100 | Yes |
| ECC failure on GPU memory page retirement | Yes |
| ECC failure on GPU page retirement | Yes |
| Too many single bit ECC errors on GPU | Yes |
| Video card not found | Yes |
| Faulty GPU link | Yes |
| Video card lost | Yes |
| Faulty GPU memory page | Yes |
| Faulty GPU engine image | Yes |
| GPU temperature too high | Yes |
| Faulty GPU NVLink | Yes |
| nvidia-smi hang | Yes |
| ECS cleared | Yes |
| ECS restarted | Yes |
| ECS shut down | Yes |
| NIC deleted | Yes |
| ECS resized | Yes |
| Hardware error reboot | Yes |
| Hardware error reboot successful | Yes |
| Auto-recovery timeout | Yes |
| Initialization error | Yes |
| GPU link error | Yes |
| FPGA link error | Yes |
| ECS error due to abnormal processes on host | Yes |
| GuestOS restarted | Yes |
| Migration started | Yes |
| Migration completed successfully | Yes |
| Error during migration | Yes |
| Risk of host crash | Yes |
| Unrecoverable ECC errors: NPU | Yes |
References
- CES documentation: https://support.huaweicloud.com/intl/en-us/function-ces/index.html
- CES limitations: https://support.huaweicloud.com/intl/en-us/productdesc-ces/ces_07_0007.html
- FAQ: https://support.huaweicloud.com/intl/en-us/ces_faq/ces_faq_0059.html
- CES agent batch installation: https://support.huaweicloud.com/intl/en-us/usermanual-ces/ces_01_0033.html