![]()
Monitoring Data Through API Calling
V1.0 – March 2024
| Version | Author | Description |
|---|---|---|
| V1.0 – 2024-03-08 | Diogo Hatz 50037923 | Initial Version |
| V1.0 – 2024-03-08 | Wisley da Silva 00830850 | Document Review |
Introduction
Cloud Eye (CES) is a free tool for monitoring Huawei Cloud resources. In addition to monitoring resources, Cloud Eye can also be used to create event- or metric-based alarms, identify resource malfunctions, and quickly react to resource changes. It is worth noting that, although Cloud Eye is a free service, charges generated by sending notifications when alarms are triggered are charged.
This document aims to describe the main functionalities of the Cloud Eye service and guide the reader to use the Cloud Eye API to monitor cloud resources, such as VPNs, through requests.
CloudEye API
To monitor resources provisioned in Huawei Cloud through APIs, it is first necessary to obtain a list of the monitoring metrics of the desired service with their respective parameters. To do this, identify the namespace of the service you want to monitor using the following hyperlink: https://support.huaweicloud.com/intl/en-us/api-ces/ces_03_0059.html. The monitoring namespace of the VPN service, for example, is configured as “SYS.VPN”.
API related to listing monitoring metrics
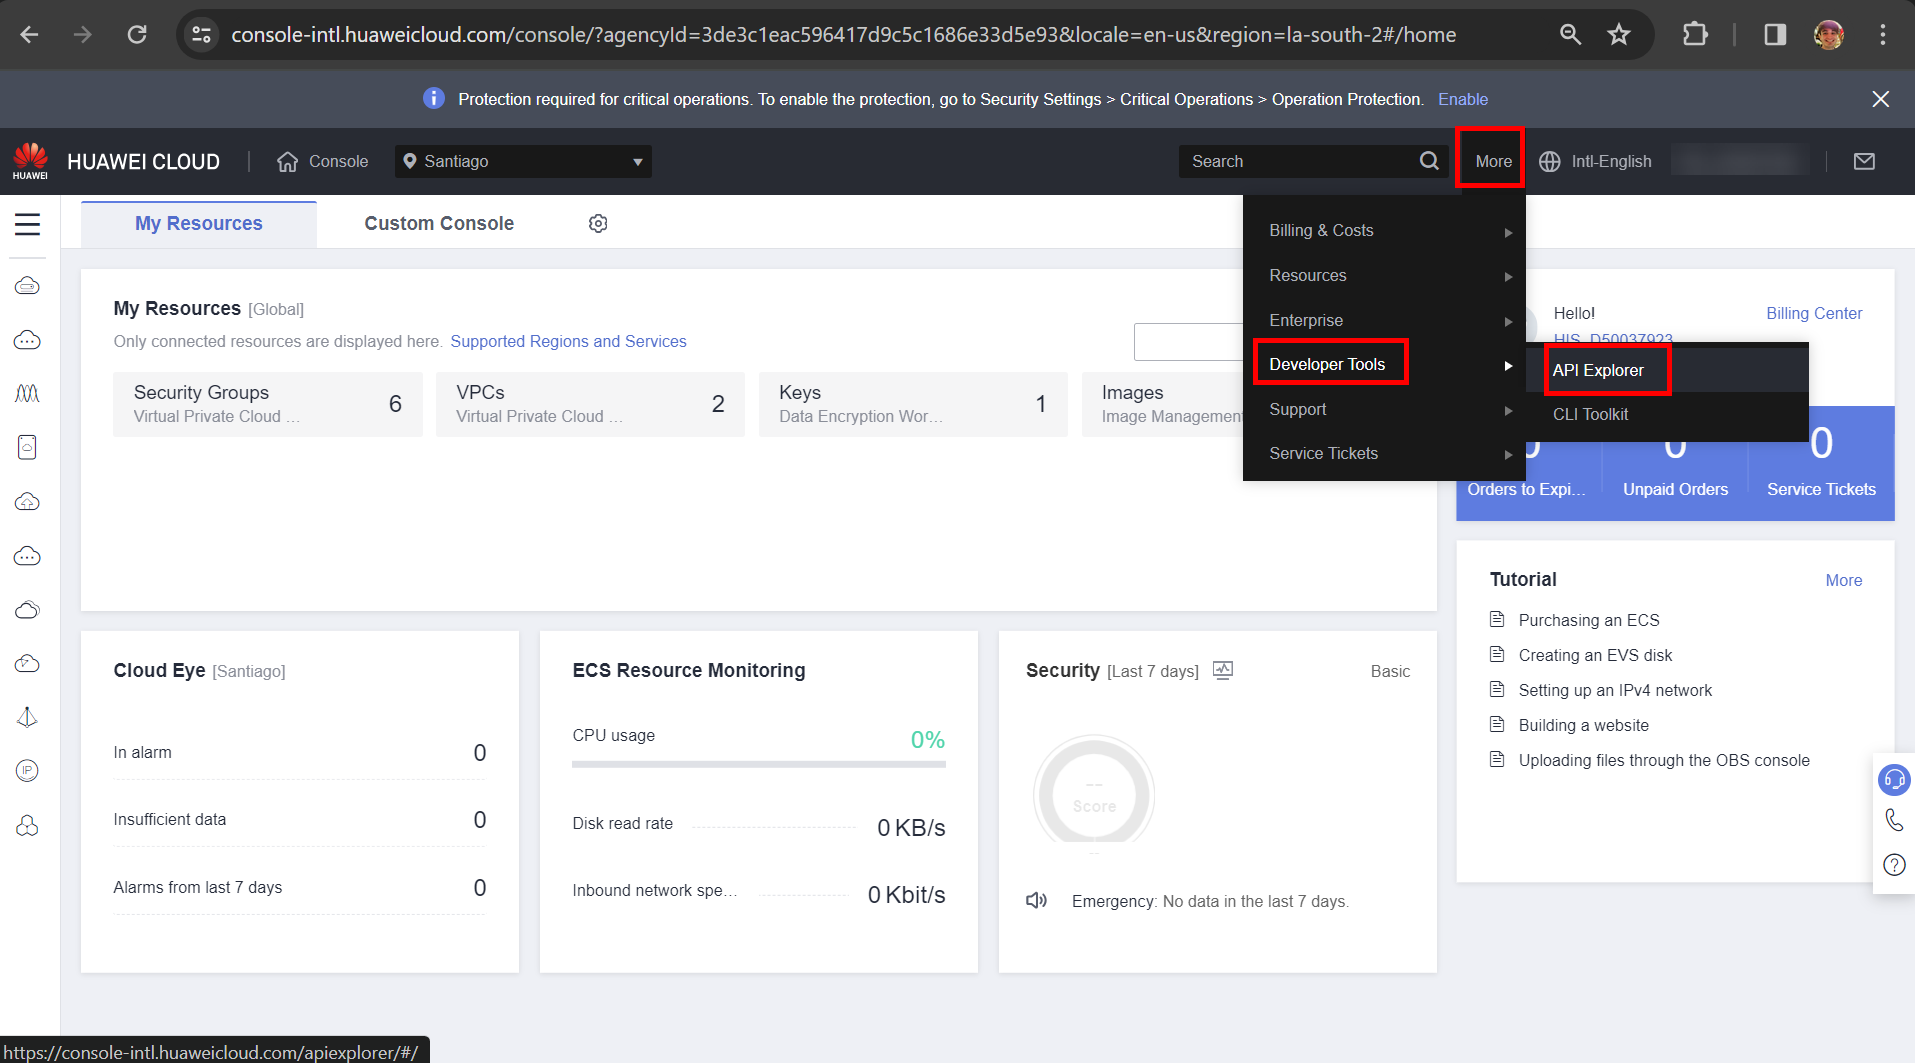
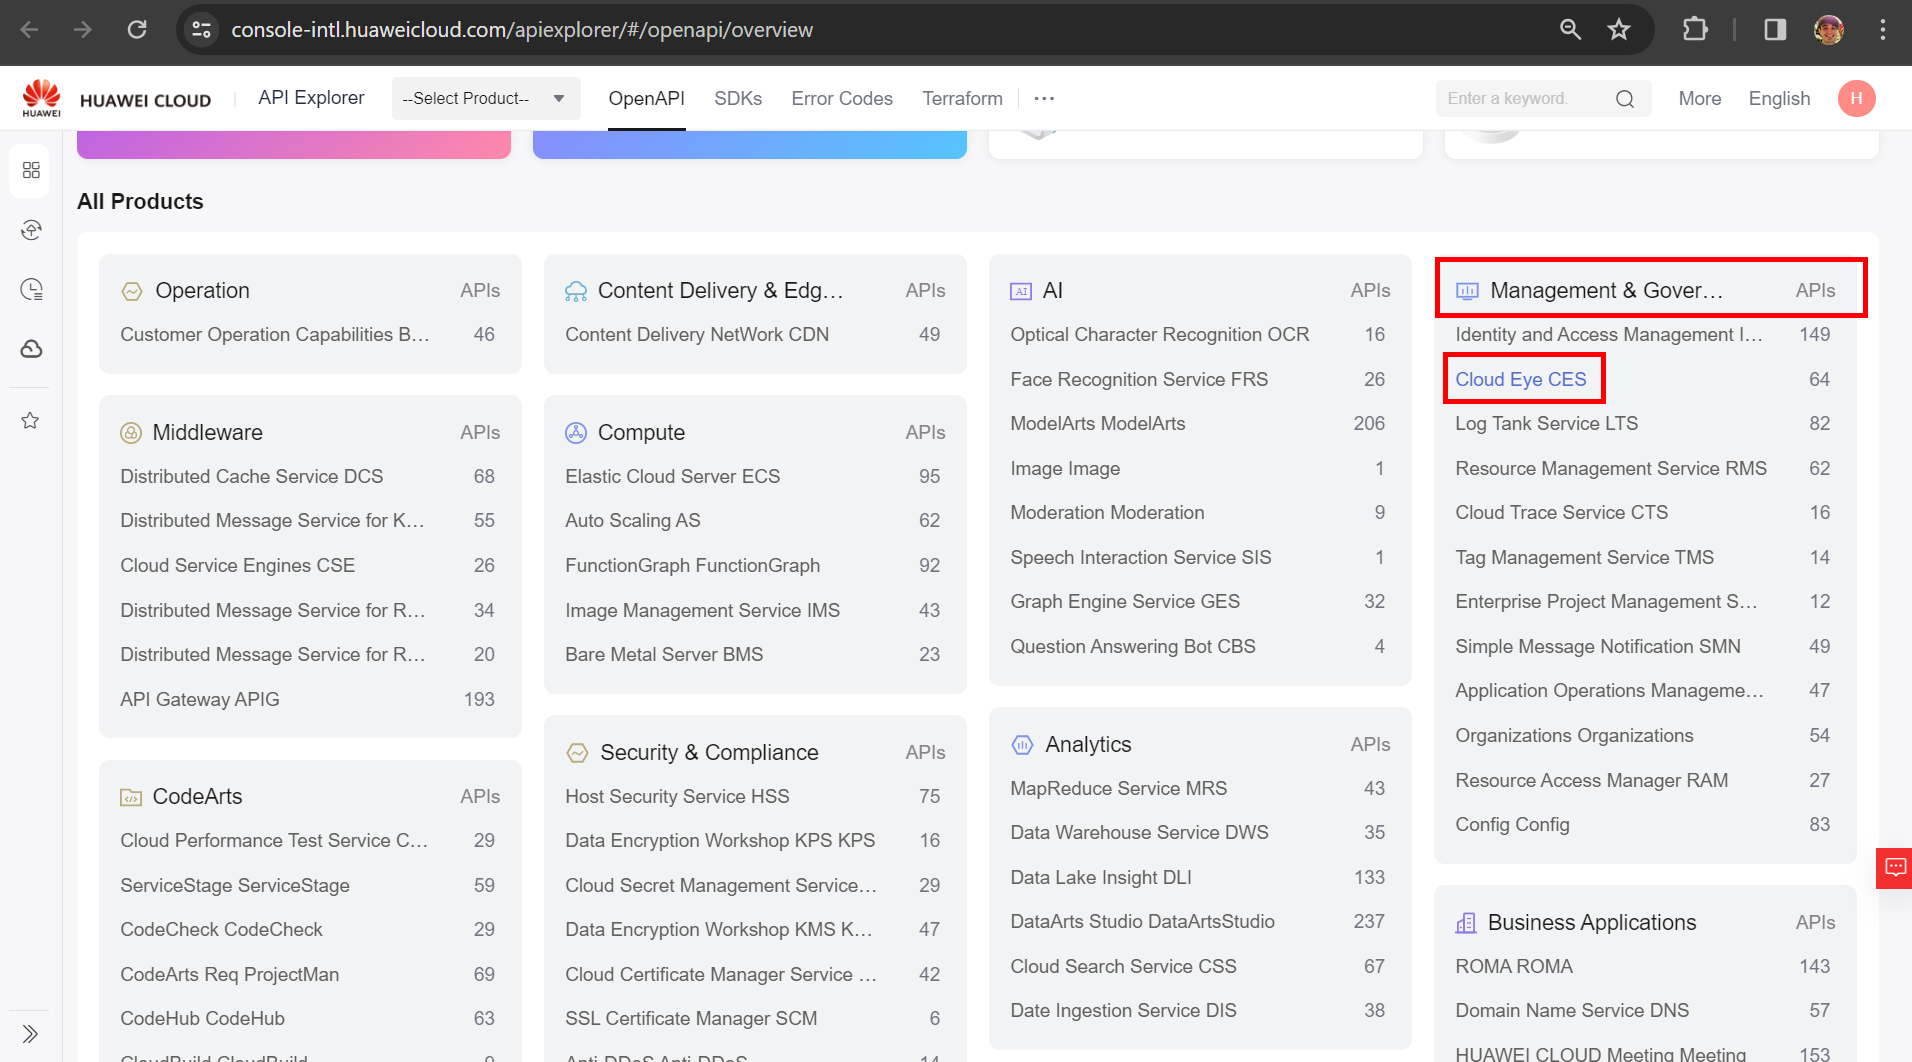
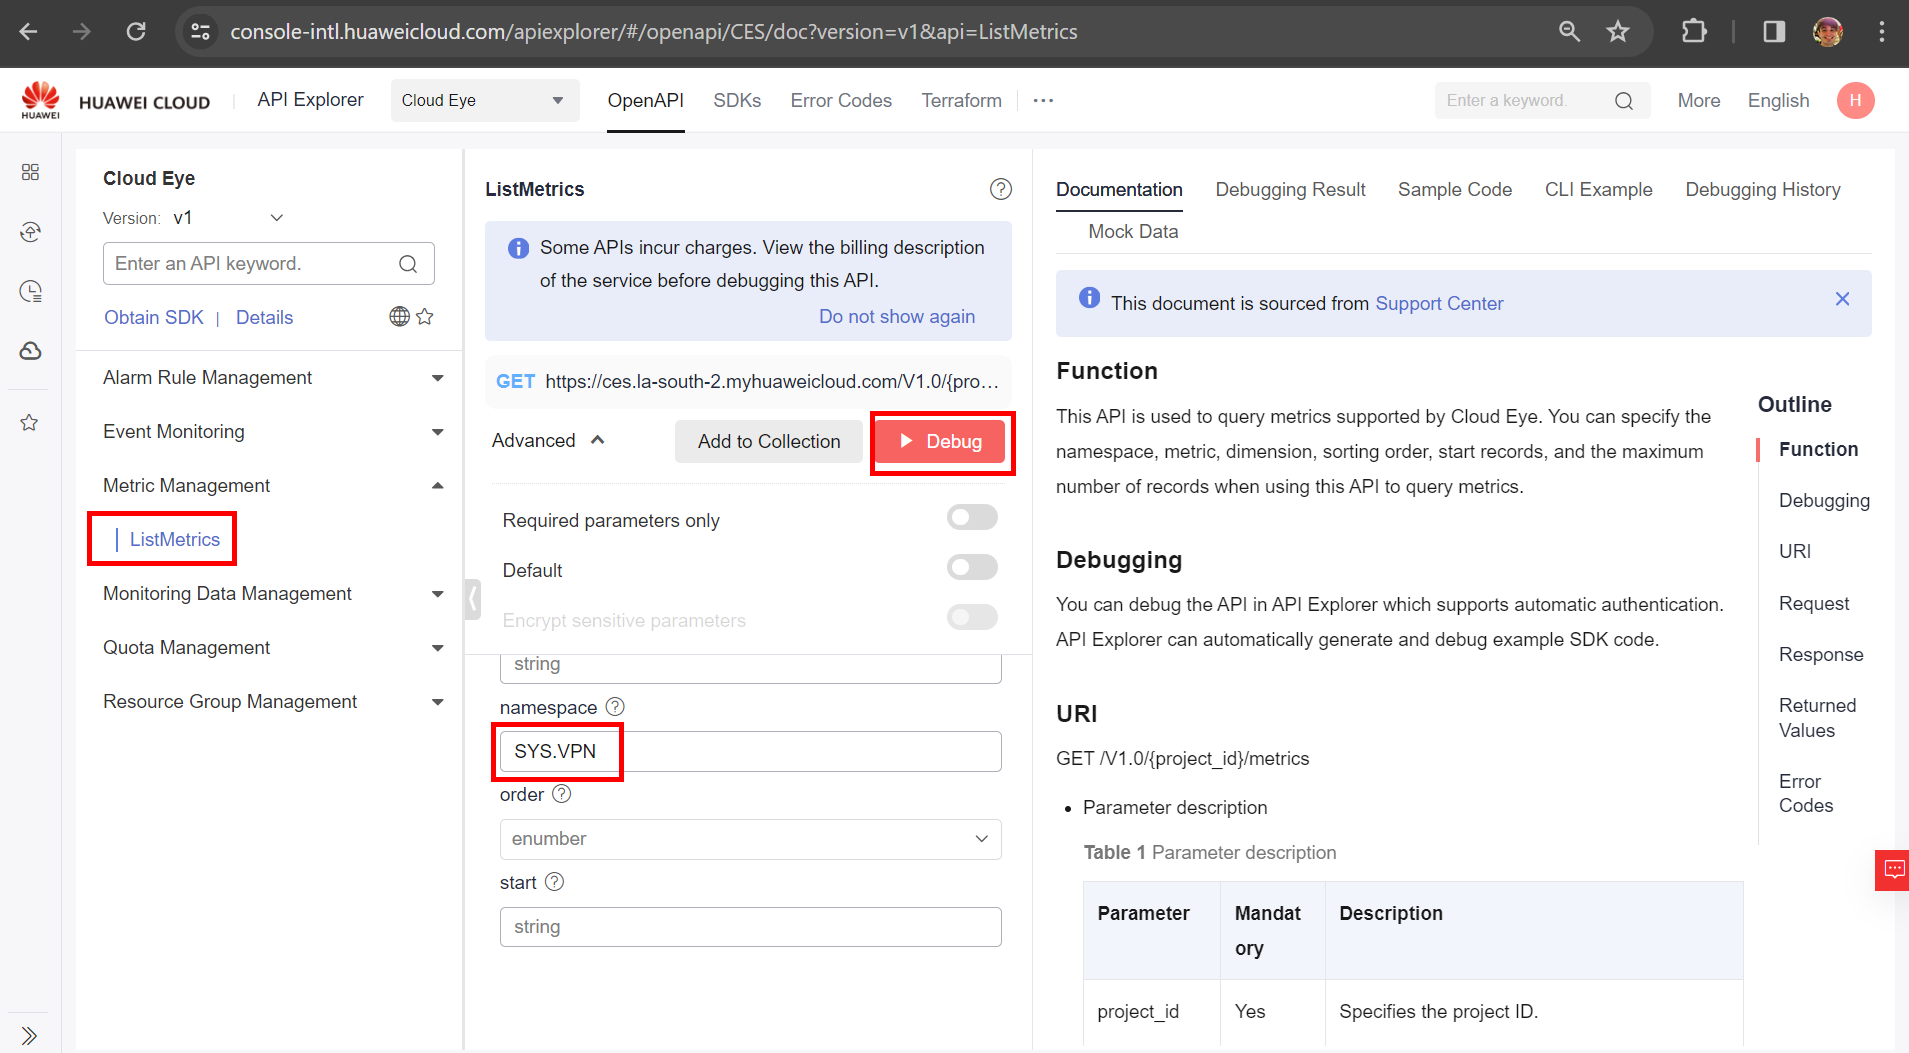
To list the monitoring metrics of a given service, simply use the “ListMetrics” API provided by HWC. Attention: To obtain the monitoring metrics of a given service, at least one resource or instance of that service must be provisioned in the region to which the API is pointing. For this guide, the Huawei Cloud API Explorer service will be used to facilitate viewing of the API parameters. The API Explorer service can be accessed through the following link: https://console-intl.huaweicloud.com/apiexplorer/#/openapi/CES/doc?version=v1&api=ListMetrics, or through the step-by-step instructions below:
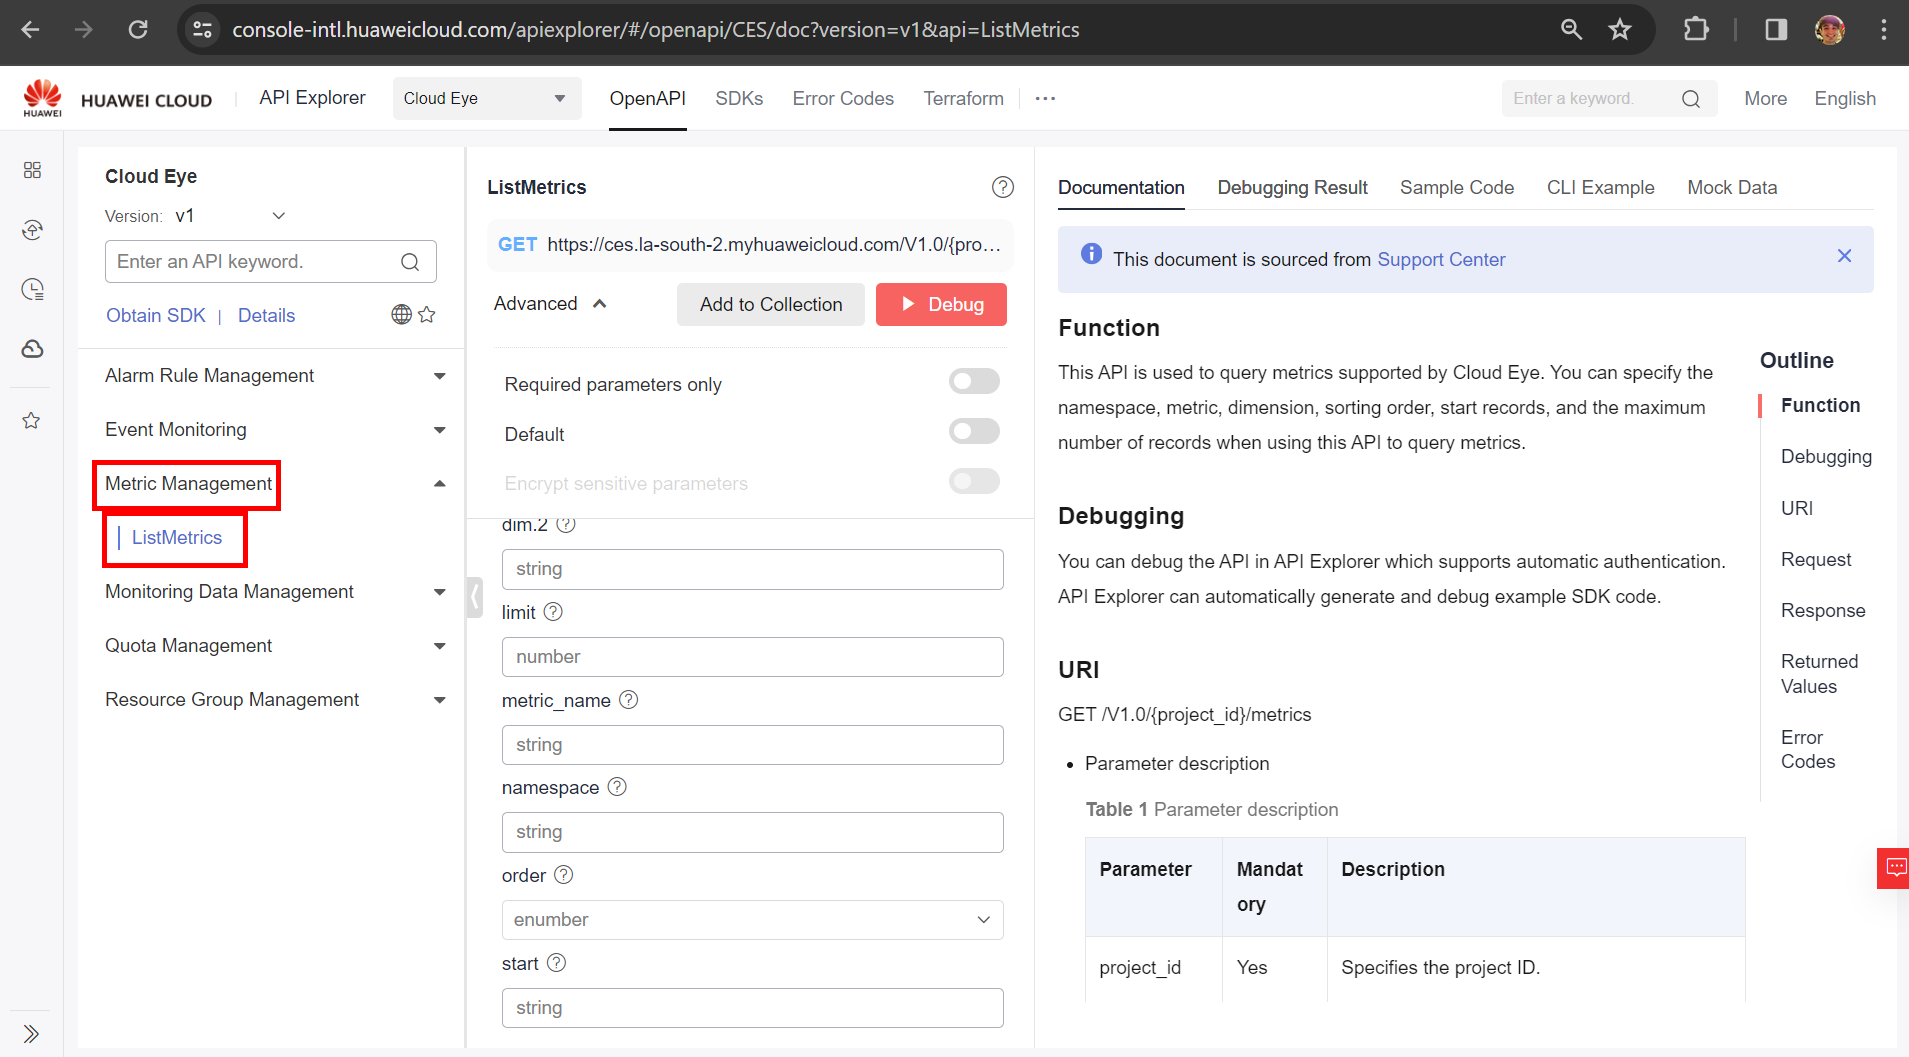
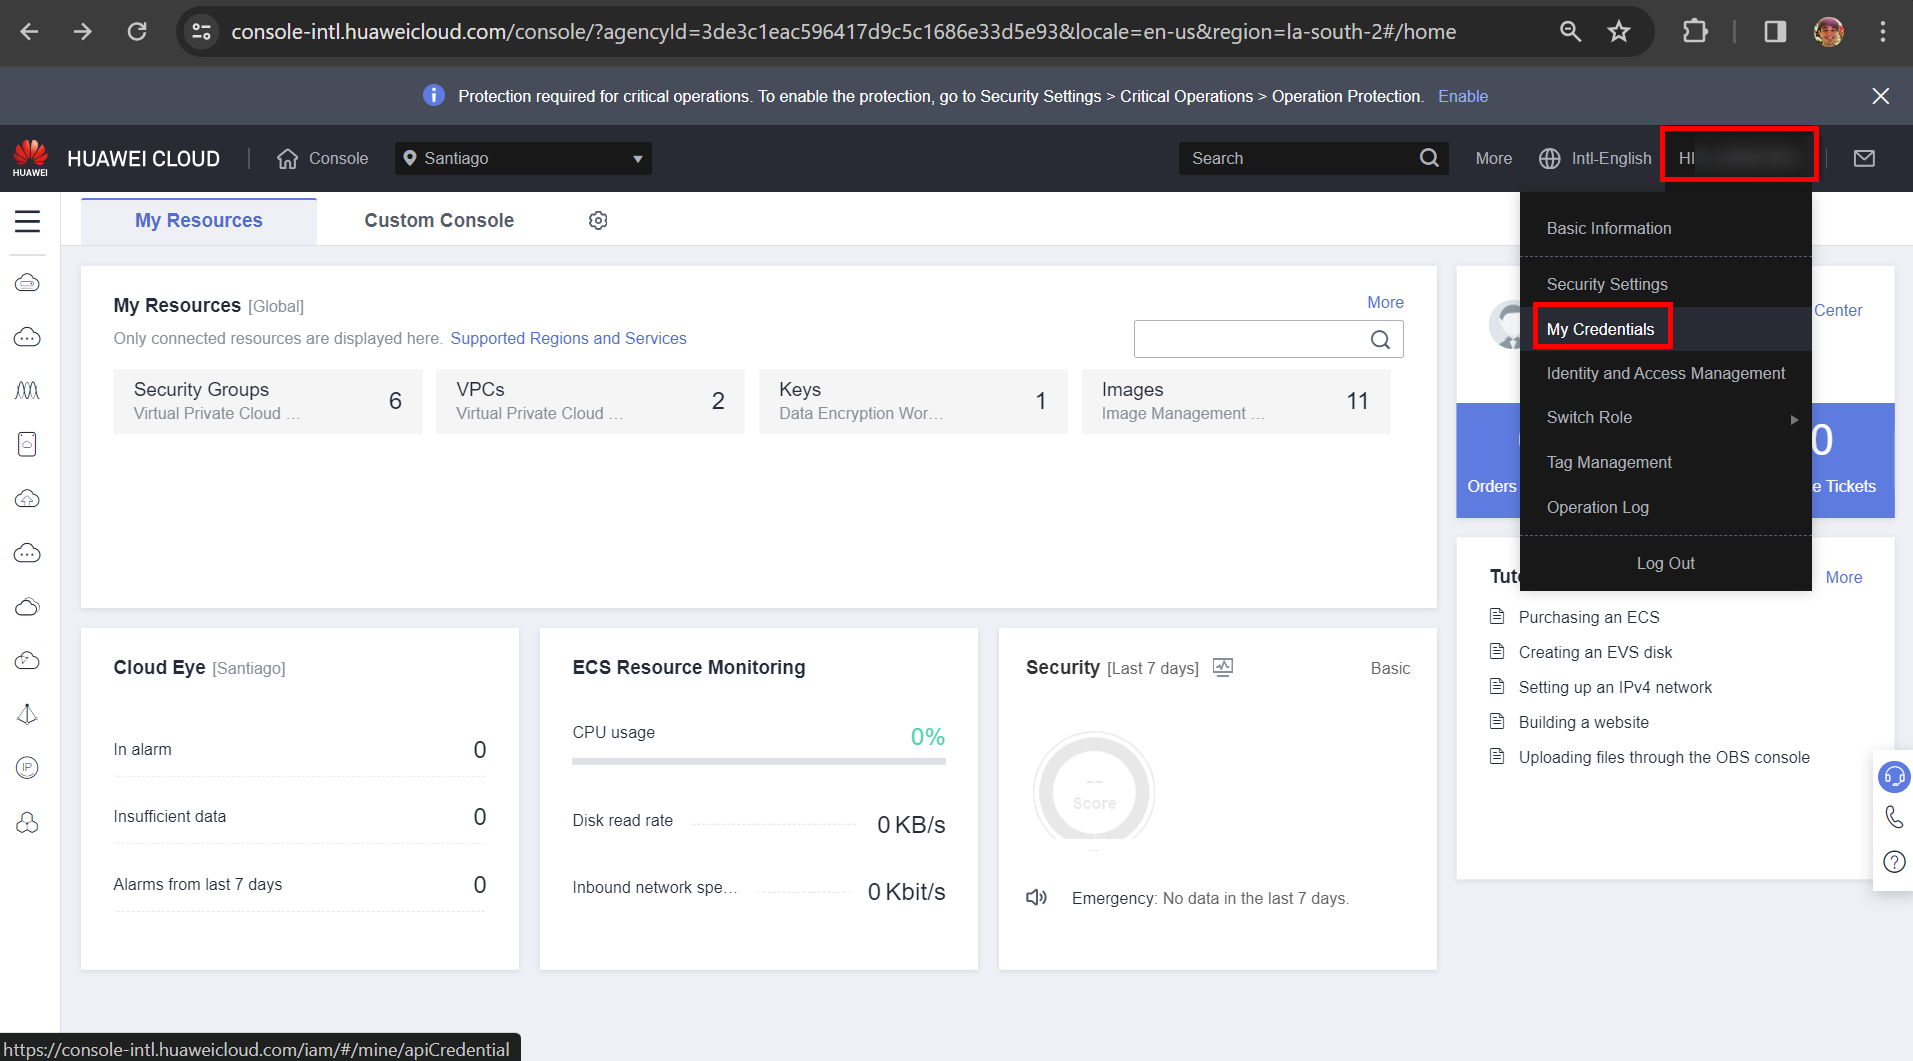
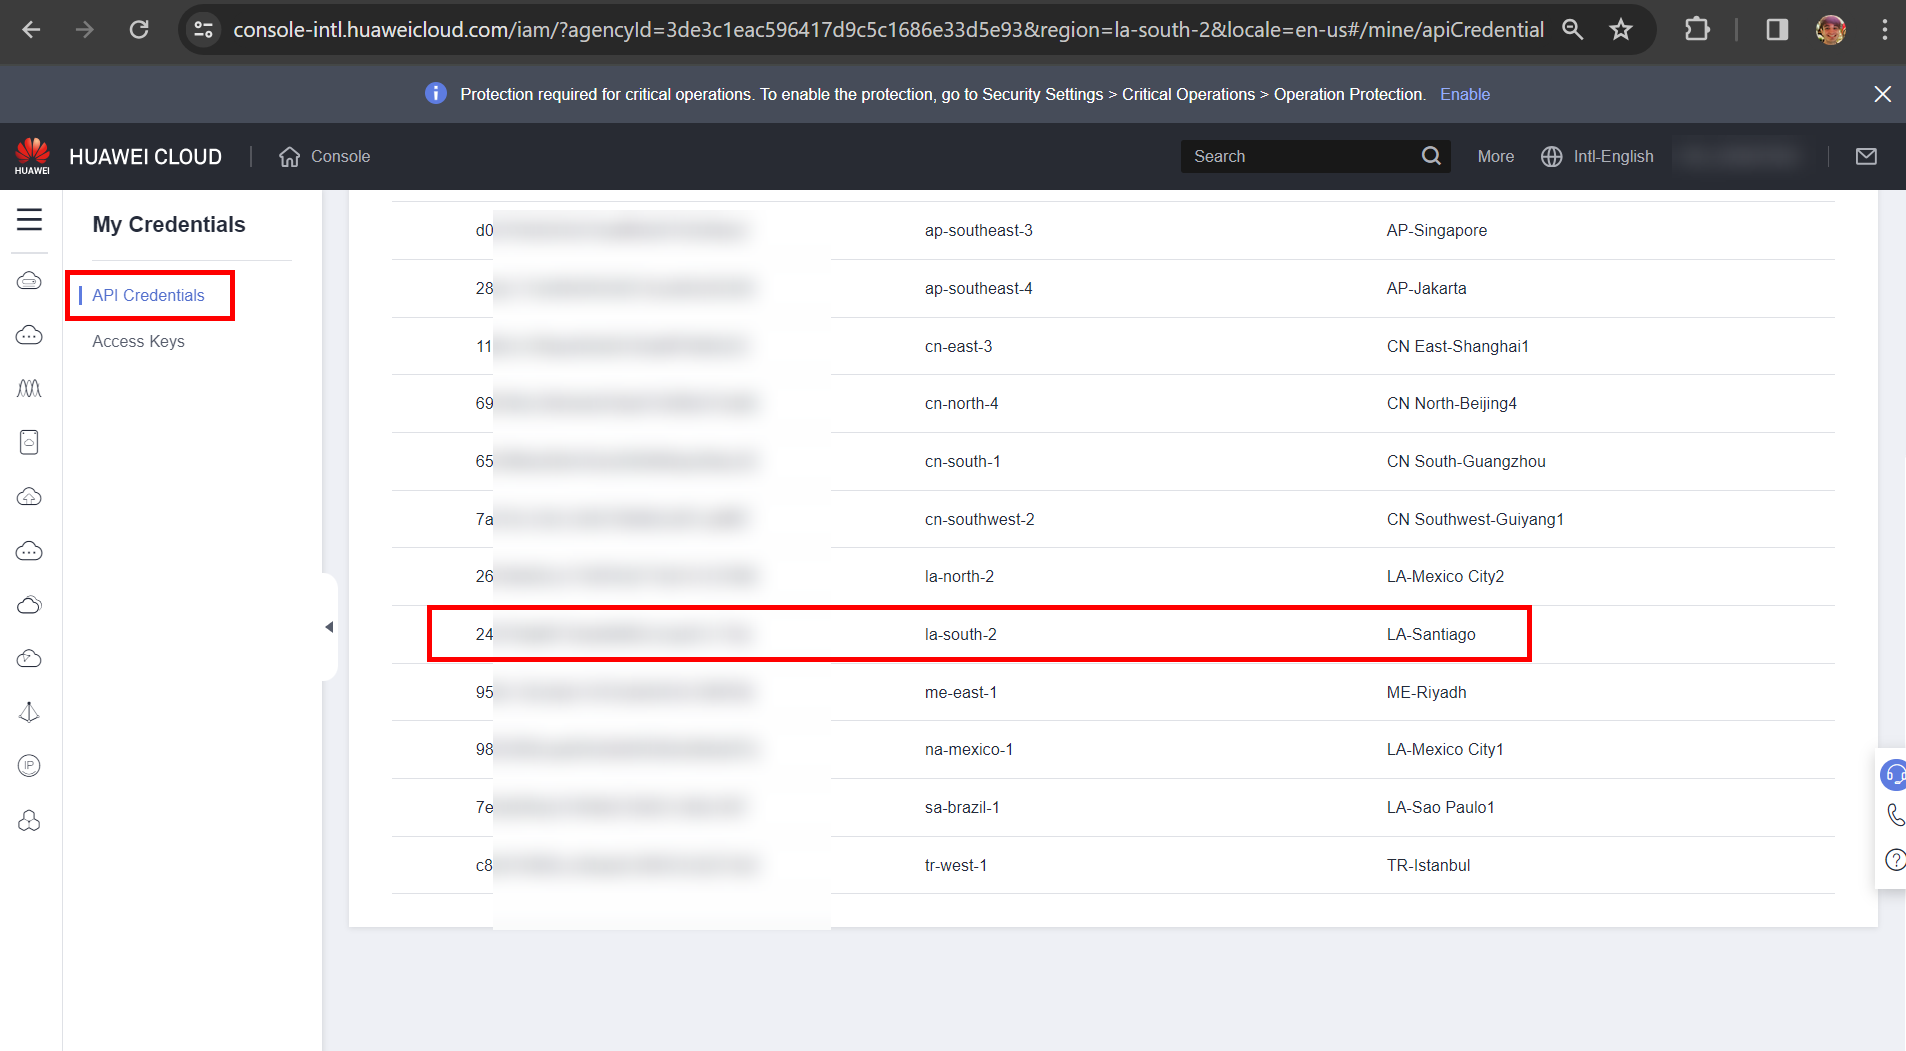
For this API, simply fill in the parameters related to the region in which the resource to be monitored is provisioned, the resource’s project ID, and the resource’s namespace. resource, which was obtained in item 3.0 of this guide. To obtain the resource’s project id, simply navigate to the following console page:
After filling in the required parameters, click “Debug” to obtain the json related to the existing monitoring metrics for the desired resource namespace.
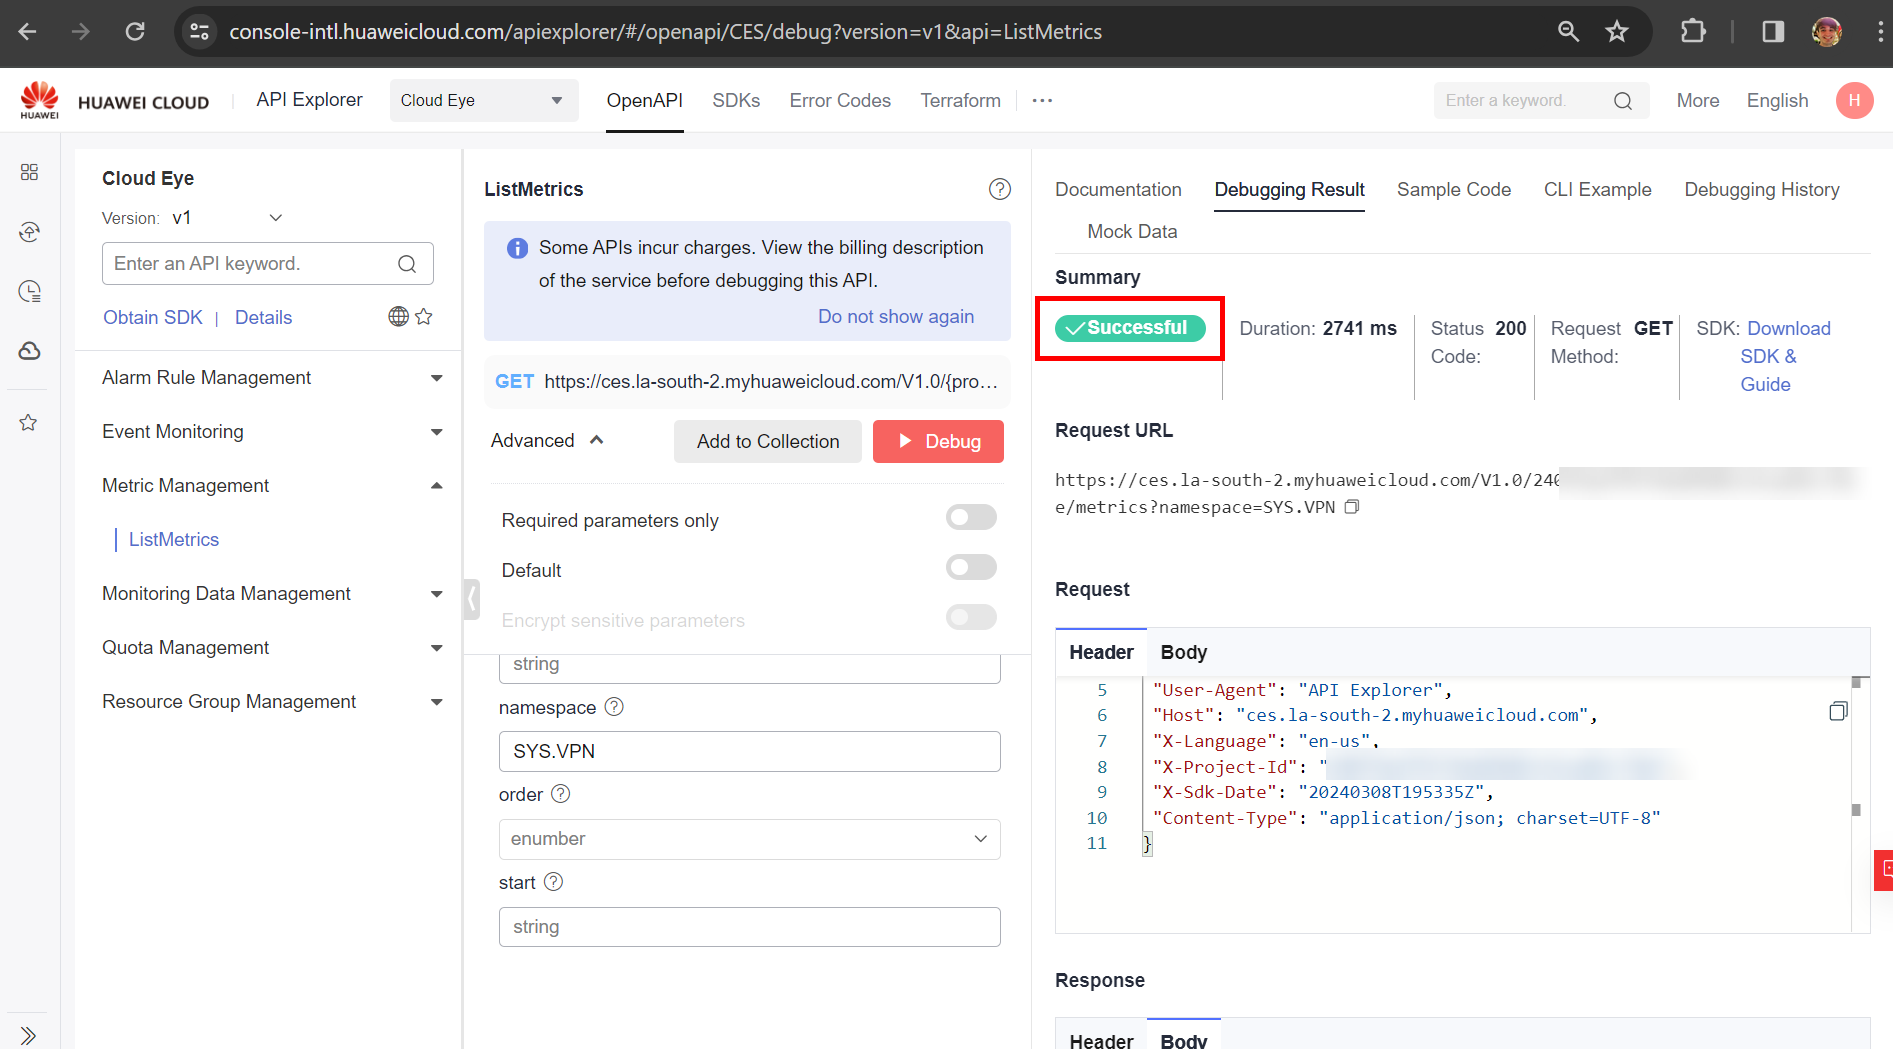
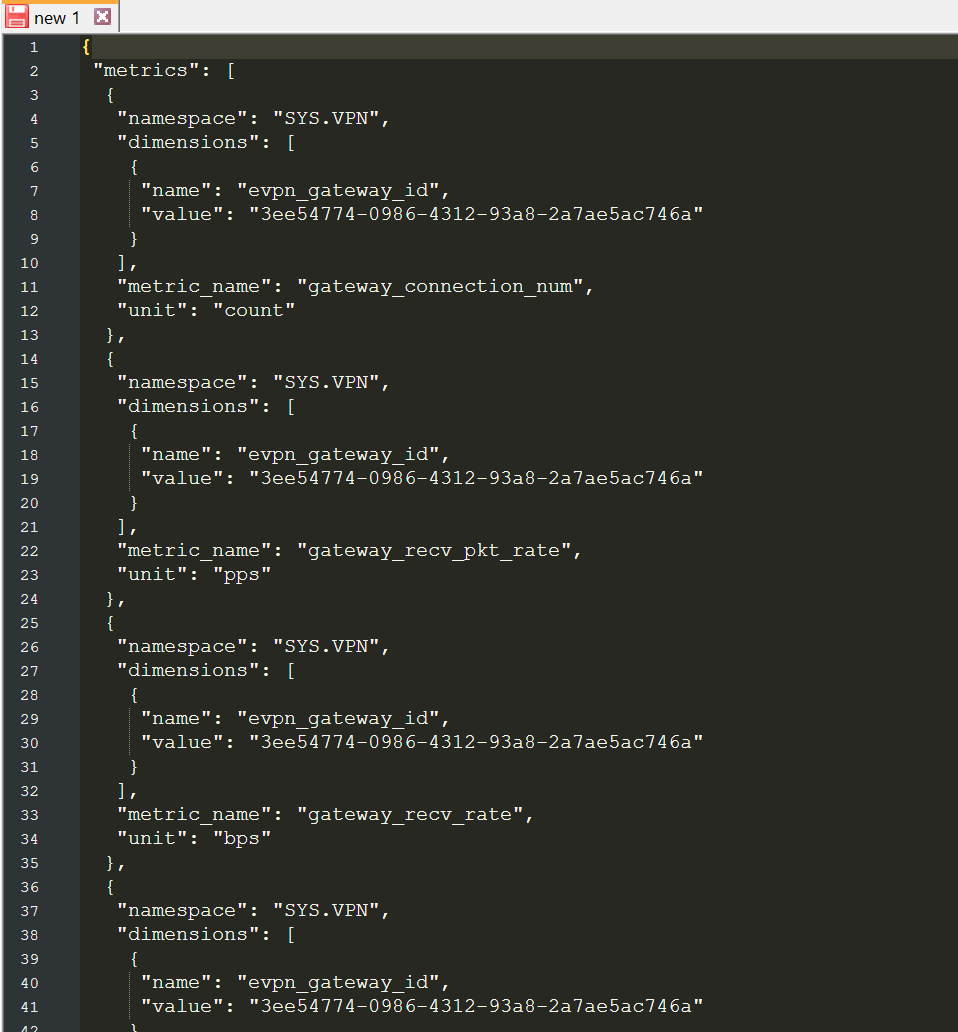
The response to the request will be a list of monitoring metrics for the desired resource, as can be seen in the figure below:
The documentation for this API can be viewed at the following link, for further details on the API configurations: https://support.huaweicloud.com/intl/en-us/api-ces/ces_03_0023.html .
API related to querying monitoring data
The API that will perform the query for the monitoring data of a given service is the “BatchListMetricData” API, which can be accessed through the following link: https://console-intl.huaweicloud.com/apiexplorer/#/openapi/CES/debug?version=v1&api=BatchListMetricData ; or through the following step-by-step:
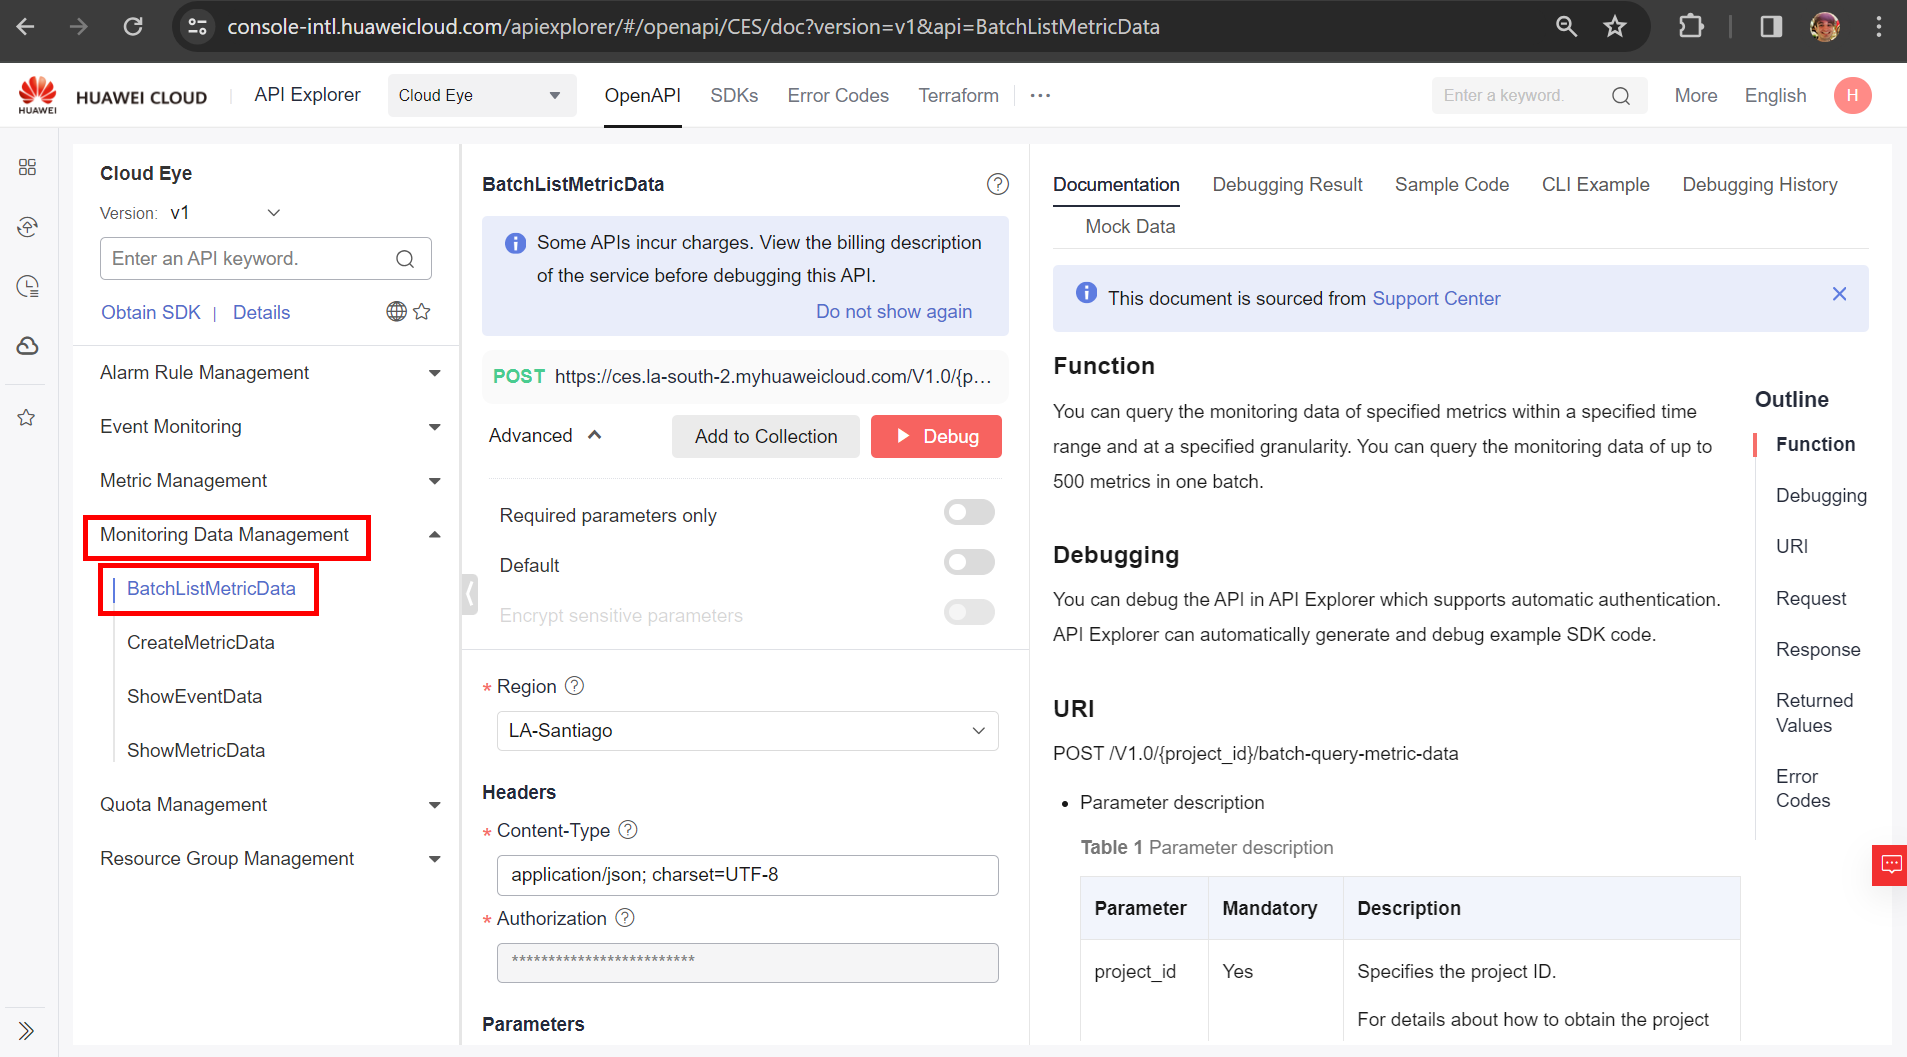
For this API, fill in all the parameters available in the API. The metric_name, name and value parameters were returned by the API related to item 3.1 of this guide, while the namespace parameter was obtained in item 3.0 of this document. For the other settings, you can see which parameters to put in the fields below:
-
period: Possible values: 1, 300, 1200, 3600, 14400 or 86400:
-
1: No aggregation is performed, the data is shown in raw format;
-
300: Data aggregation is performed every 5 minutes;
-
1200: Data aggregation is performed every 20 minutes;
-
3600: Data aggregation is performed every 60 minutes;
-
14400: Data aggregation is performed every 4 hours;
-
86400: Data aggregation is performed every 24 hours.
-
-
filter: Possible values: max, min, average, sum or variance.
-
Max: Returns the maximum values of the data;
-
Min: Returns the minimum values of the data;
-
Average: Returns an average of the data;
-
Variance: Returns the variance of the data.
-
-
from: The start period of the search. This time parameter uses the UNIX time unit in milliseconds. A standard time converter for UNIX can be found at the following page: https://www.unixtimestamp.com/. After performing the conversion, add three zeros (0) to the number, so that it is represented in milliseconds.
-
to: The end period of the search. This time parameter uses the UNIX time unit in milliseconds. A standard time converter for UNIX can be found at the following page: https://www.unixtimestamp.com/. After performing the conversion, add three zeros (0) to the number, so that it is represented in milliseconds.
Request example:
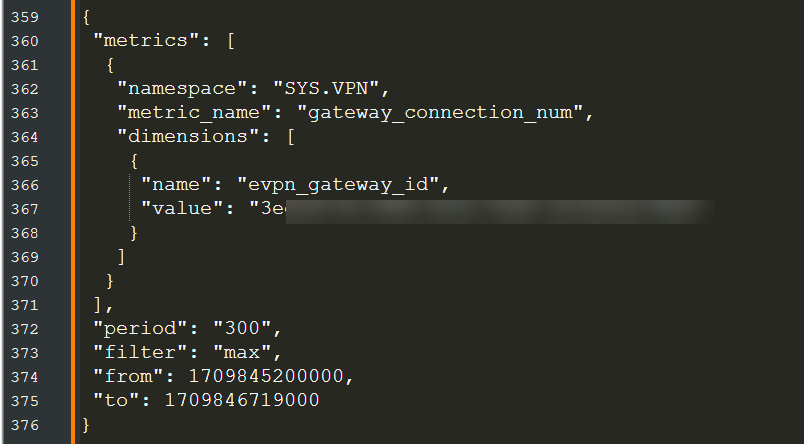
After filling in all the parameters, select the “Debug” button to obtain the response from the API request:
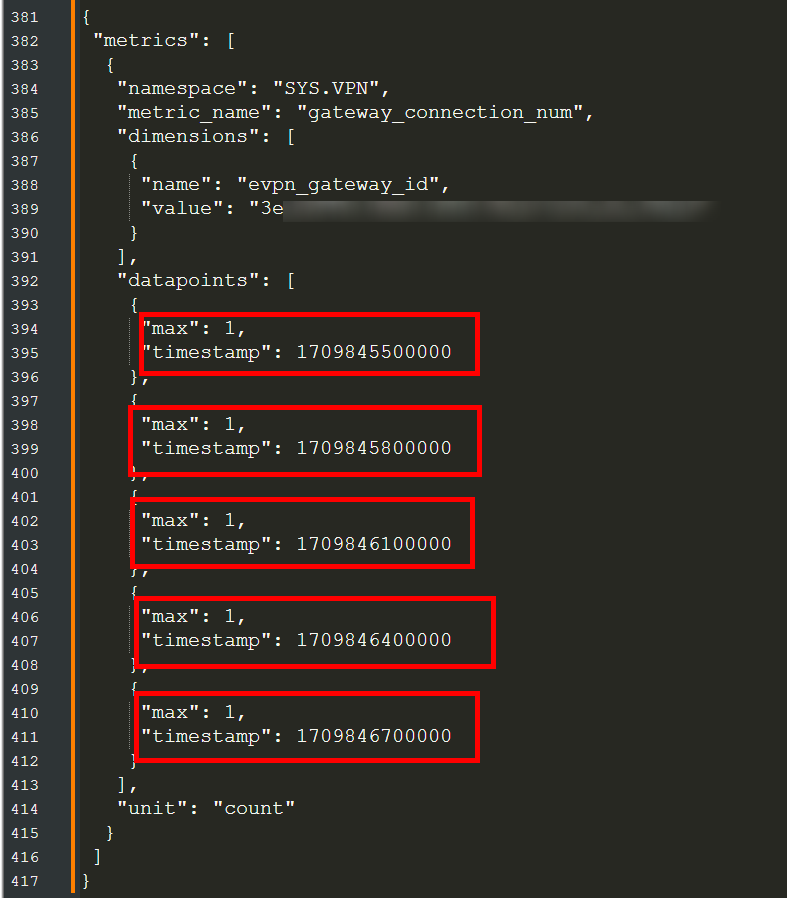
The metric used as an example is related to the number of connections present on the gateway of a given VPN. The documentation for this API can be viewed at the following link, for further details: https://support.huaweicloud.com/intl/en-us/api-ces/ces_03_0034.html .
Other request settings
To obtain a template for the header and body of the API request, use the API Explorer service listed above from Huawei Cloud or refer to the documentation via the following link: https://support.huaweicloud.com/intl/en-us/api-ces/ces_03_0002.html . By following the step-by-step instructions in the documentation, you can see how to structure the request, the request endpoint, authentication, etc.
Attachments
VPN Gateway Monitoring Metrics
| Metrics | Supported |
|---|---|
| Inbound packet rate | Yes |
| Outbound packet rate | Yes |
| Inbound bandwidth | Yes |
| Outbound bandwidth | Yes |
| Inbound bandwidth usage | Yes |
| Number of connections | Yes |
| Outbound Bandwidth Usage | Yes |
VPN Connection Monitoring Metrics
| Metrics | Supported |
|---|---|
| Tunnel Average RTT | Yes |
| Tunnel Max RTT | Yes |
| Tunnel Packet Loss Rate | Yes |
| Link Average RTT | Yes |
| Link Max RTT | Yes |
| Link Packet Loss Rate | Yes |
| VPN Connection Status | Yes |
| Packet Receive Rate | Yes |
| Packet Send Rate | Yes |
| Traffic Receive Rate | Yes |
| Traffic Send Rate | Yes |
| SA Packet Send Rate | Yes |
| SA Packet Receive Rate | Yes |
| SA Traffic Send Rate | Yes |
References
- CES Documentation: https://support.huaweicloud.com/intl/en-us/function-ces/index.html
- CloudEye API: https://support.huaweicloud.com/intl/en-us/api-ces/en-us_topic_0171212514.html
- ListMetrics API: https://support.huaweicloud.com/intl/en-us/api-ces/ces_03_0023.html
- BatchListMetricData API: https://support.huaweicloud.com/intl/en-us/api-ces/ces_03_0034.html
- Cloud Eye API: https://support.huaweicloud.com/intl/en-us/api-ces/ces_03_0002.html