![]()
Resources Monitoring
V1.1 – December 2023
| Version | Author | Description |
|---|---|---|
| V1.0 – 2023-12-20 | Diogo Hatz 50037923 | Initial Version |
| V1.0 – 2023-12-21 | Wisley da Silva 00830850 | Document Review |
Introduction
Cloud Eye (CES) is a free tool for monitoring Huawei Cloud resources. In addition to resource monitoring, Cloud Eye can also be used to create event- or metric-based alarms, identify resource malfunctions, and quickly react to resource changes. It is worth noting that, although Cloud Eye is a free service, charges for sending notifications when alarms are triggered are charged.
This document aims to describe the main functionalities of the Cloud Eye service and guide the reader to use CES for monitoring cloud resources, such as ECSs, VPNs, and CBRs, etc. In addition, it also describes how to create event- or metric-based alarms and customize dashboards for resource monitoring.
Cloud Eye on the console
Overview
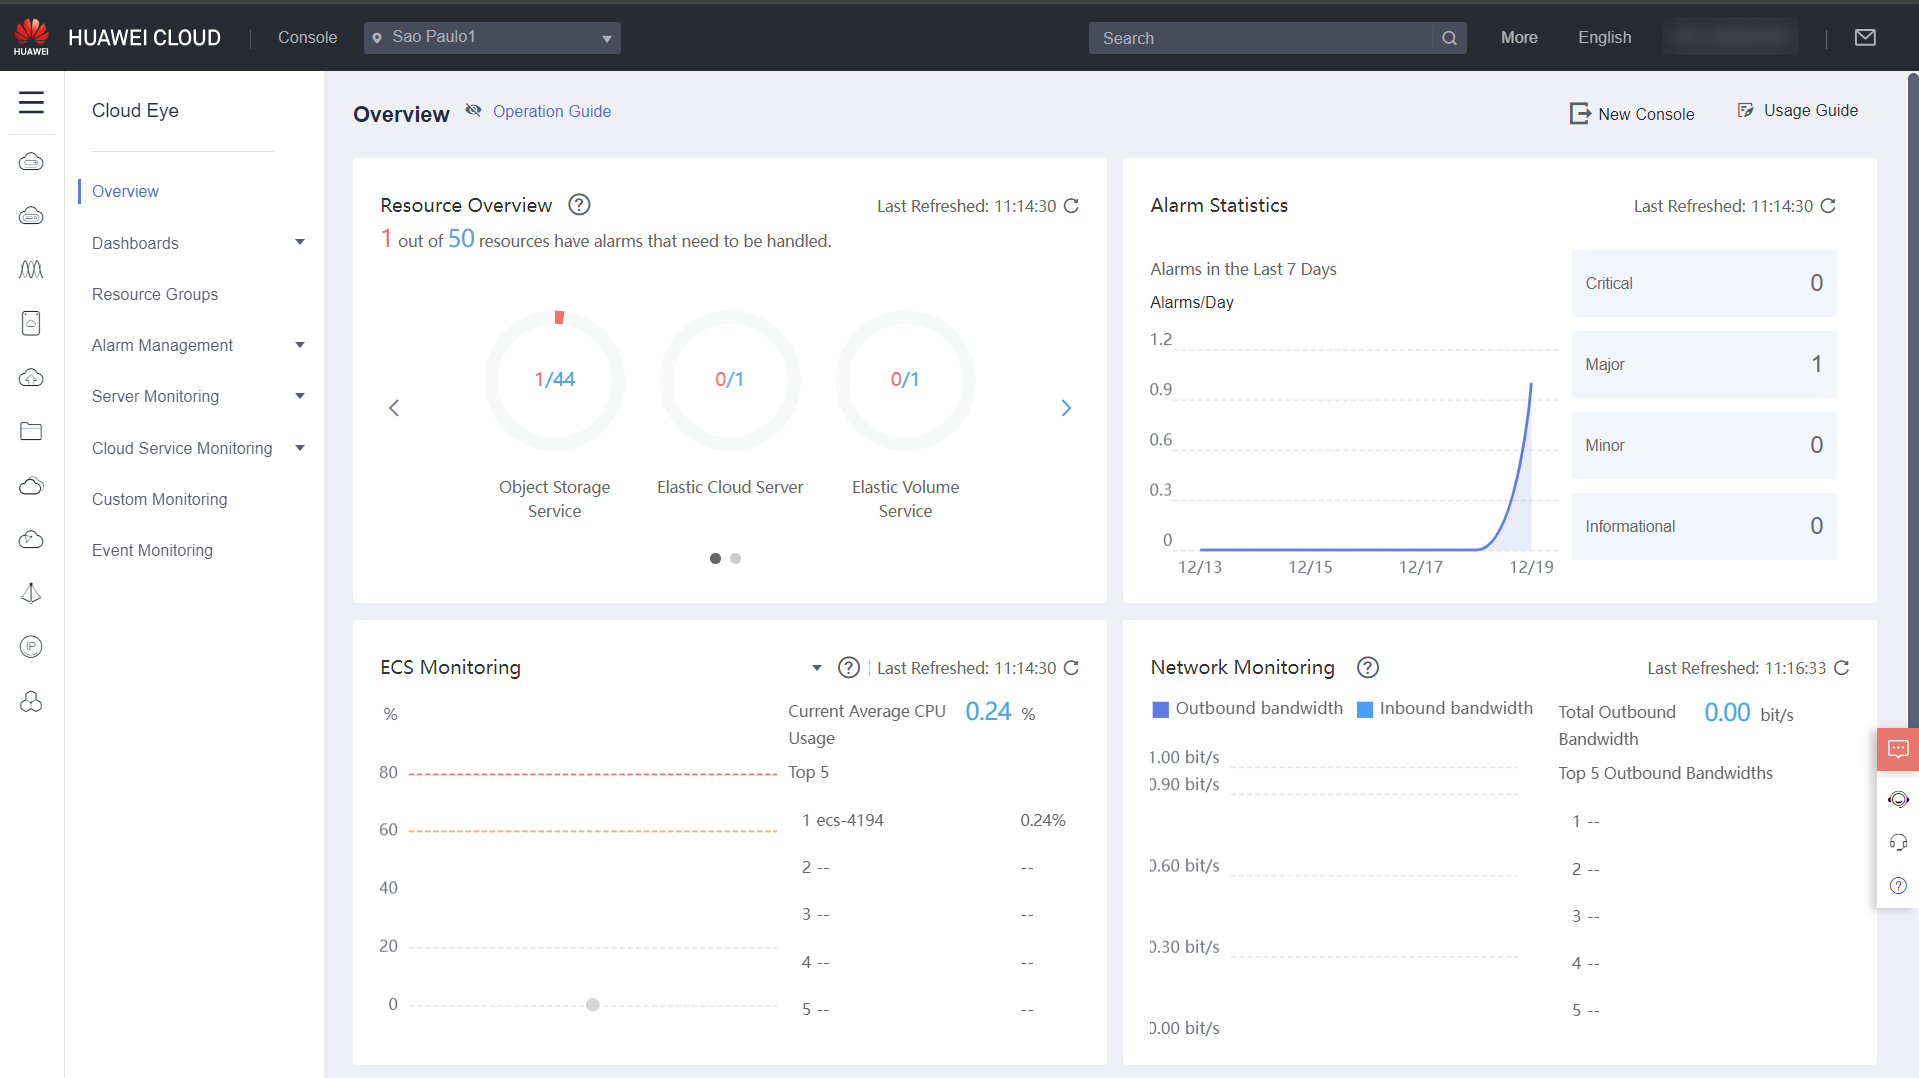
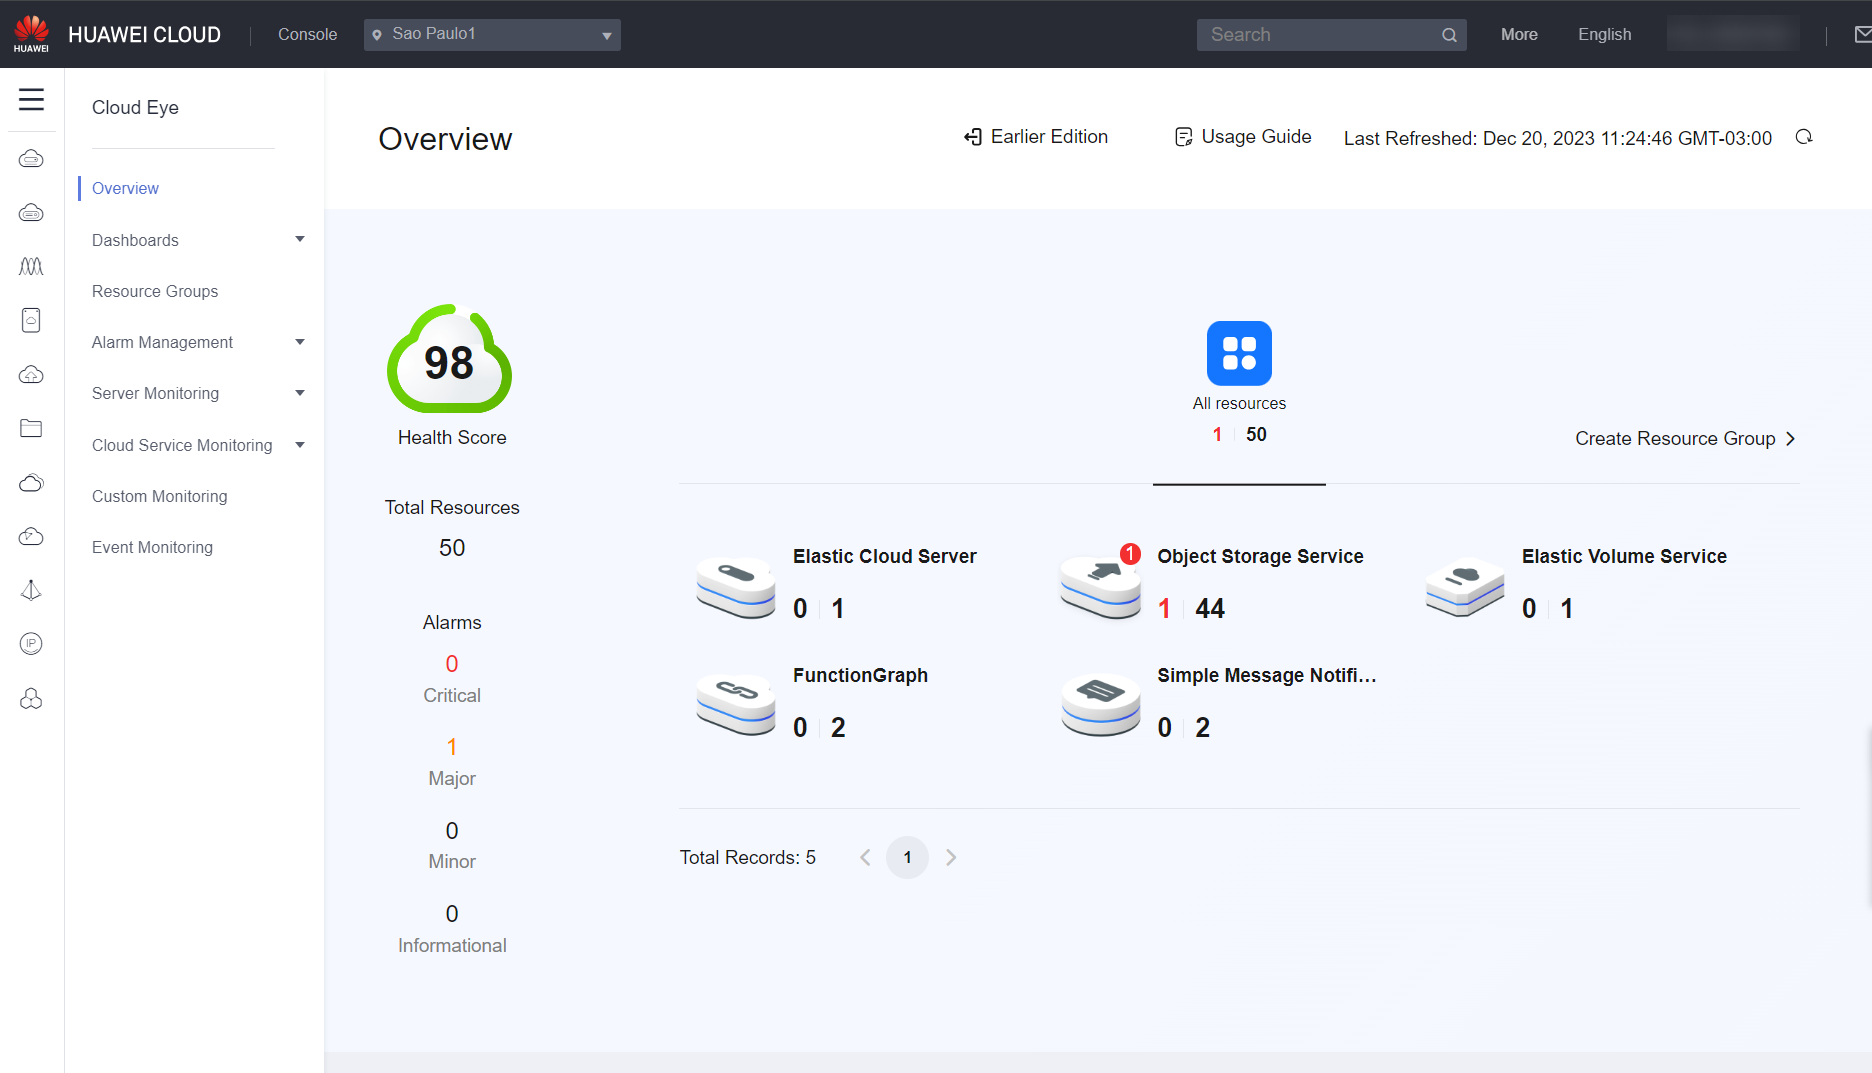
When you open Cloud Eye on the console, the home page that will load is the Overview, where you can see an overview of all resources used in Huawei Cloud, the overall network, CPU, memory, and disk utilization, and which resources have recently triggered alarms and need further attention.
-
Resource Overview: Allows you to view the total number of monitored resources and the alarms generated for these resources.
-
Alarm Statistics: Shows the alarms triggered in the last seven days by alarm severity.
-
Server Monitoring: Allows you to view the overall CPU and memory utilization of monitored servers and a list of the top 5 ECSs ranked by CPU or memory utilization.
-
Network Monitoring: Shows the overall bandwidth utilization of EIPs and a list of the top 5 EIPs ranked by bandwidth utilization.
-
Storage Monitoring: Allows you to view the overall disk utilization (EVS) by read and write IOPS and a list of the top 5 disks ranked by IOPS.
You can see what the Cloud Eye home page looks like in the images below:
Server Monitoring
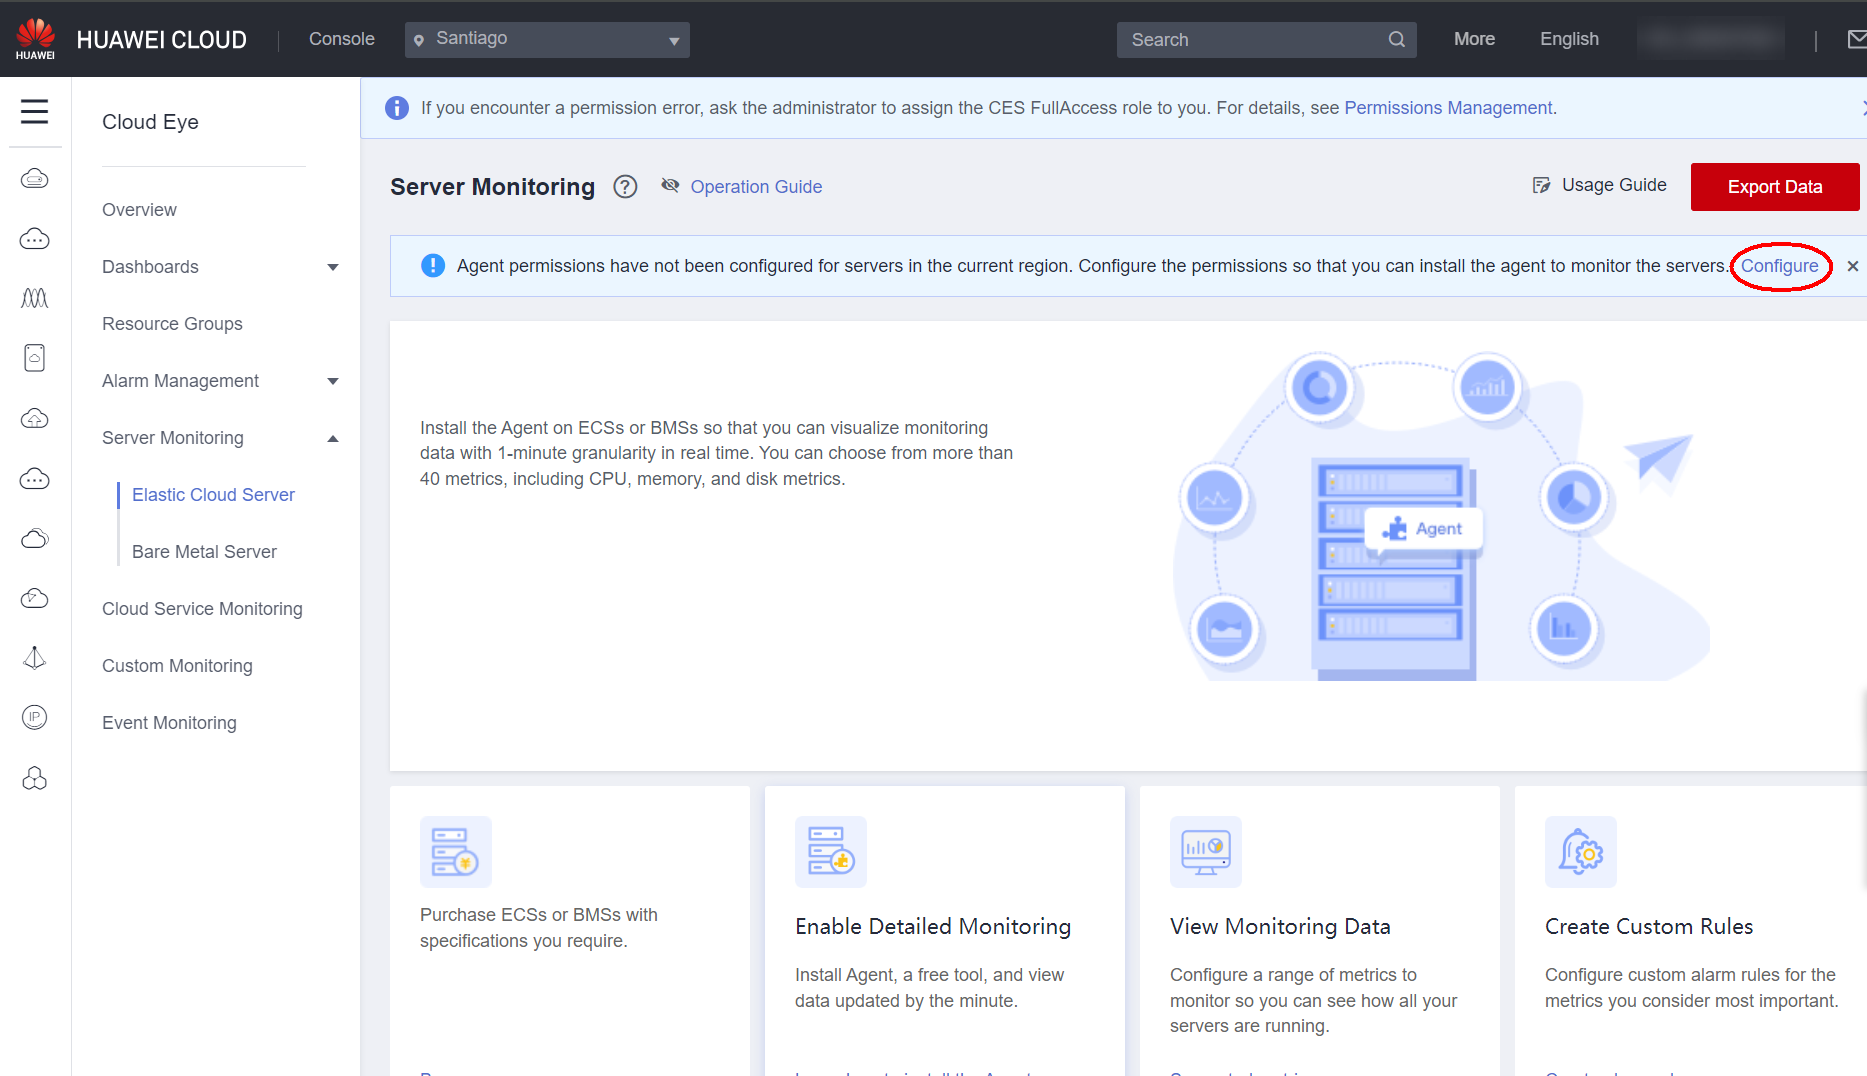
Server Monitoring (ECSs and BMSs) can be viewed in the Server Monitoring section. It is worth noting that for server monitoring, installing the agent (Telescope) is recommended, since it provides more specific and accurate metrics, according to appendix 4.1.
The agent can be installed in three different ways: manually, automatically, or in batch mode. Regardless of the installation method chosen, you must configure the permissions for the agent in advance: in the server monitoring section, click Configure on the warning that the agent permission has not been configured for the current region.
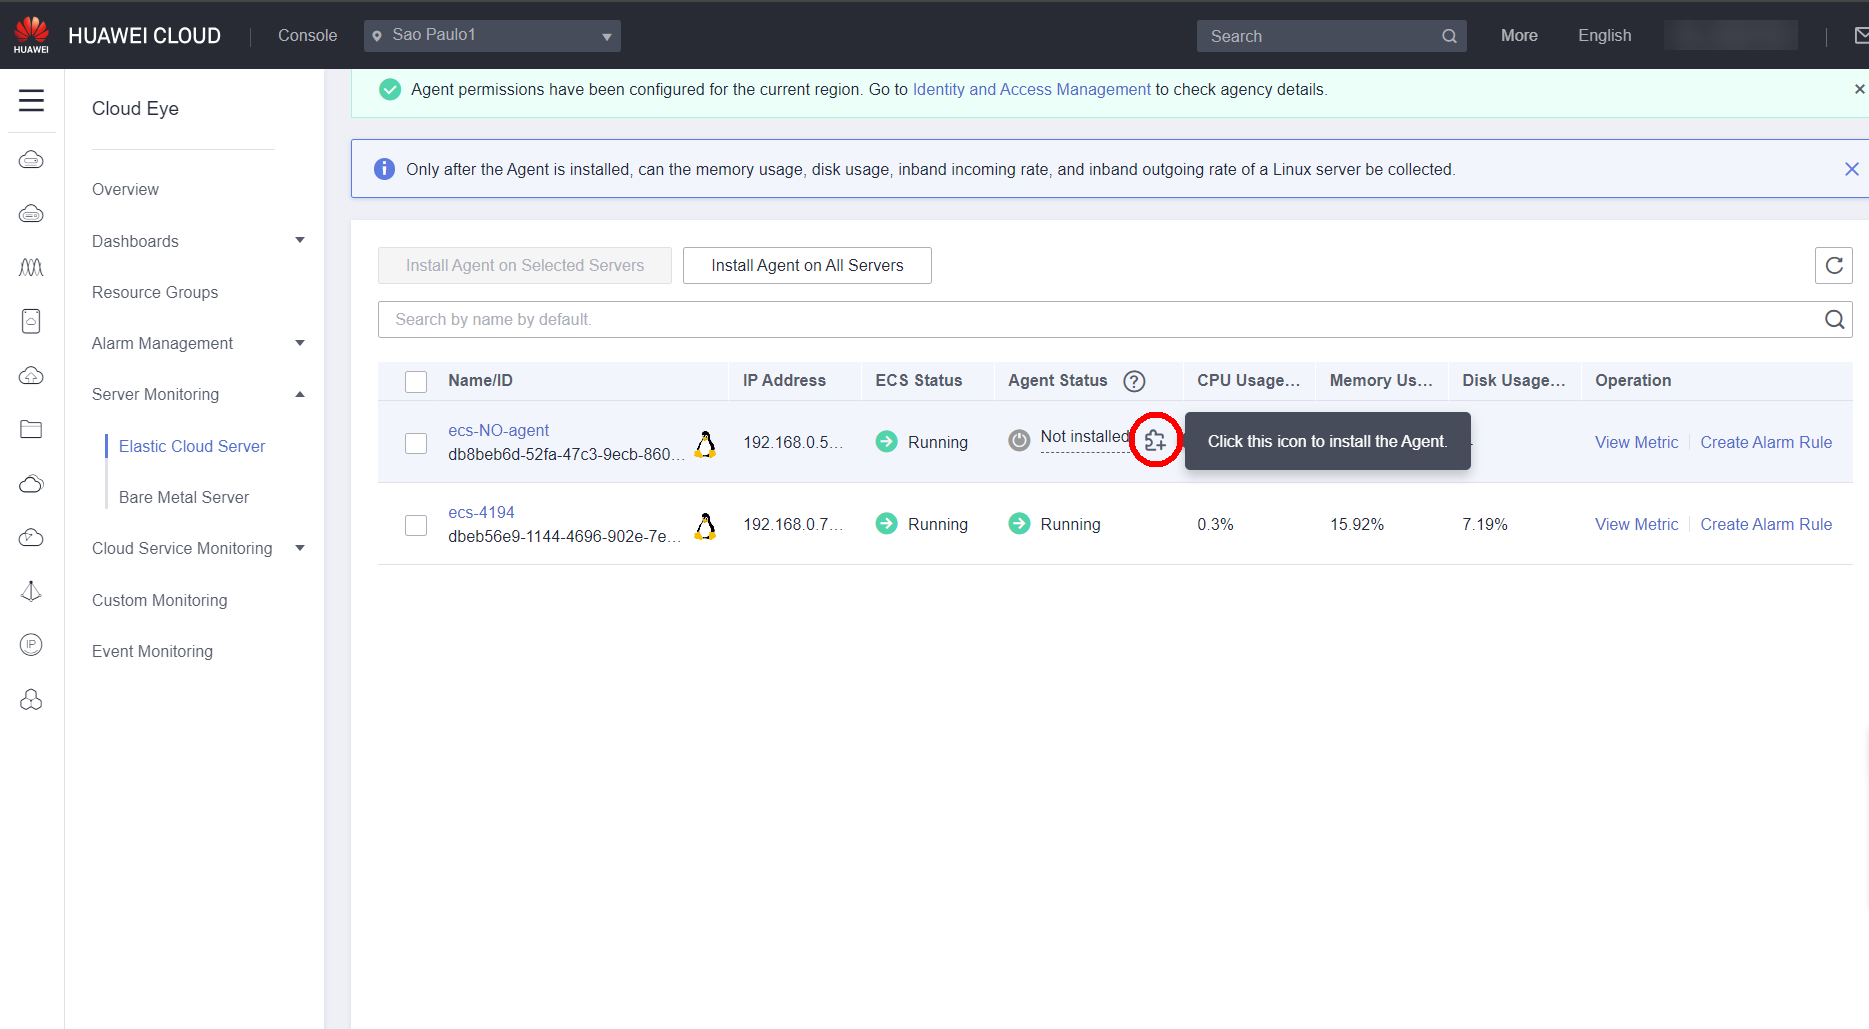
Automatic:
To install the agent automatically, simply click on the puzzle piece in the server monitoring section and in the agent status column in the corresponding ECS/BMS and wait for the agent to install.
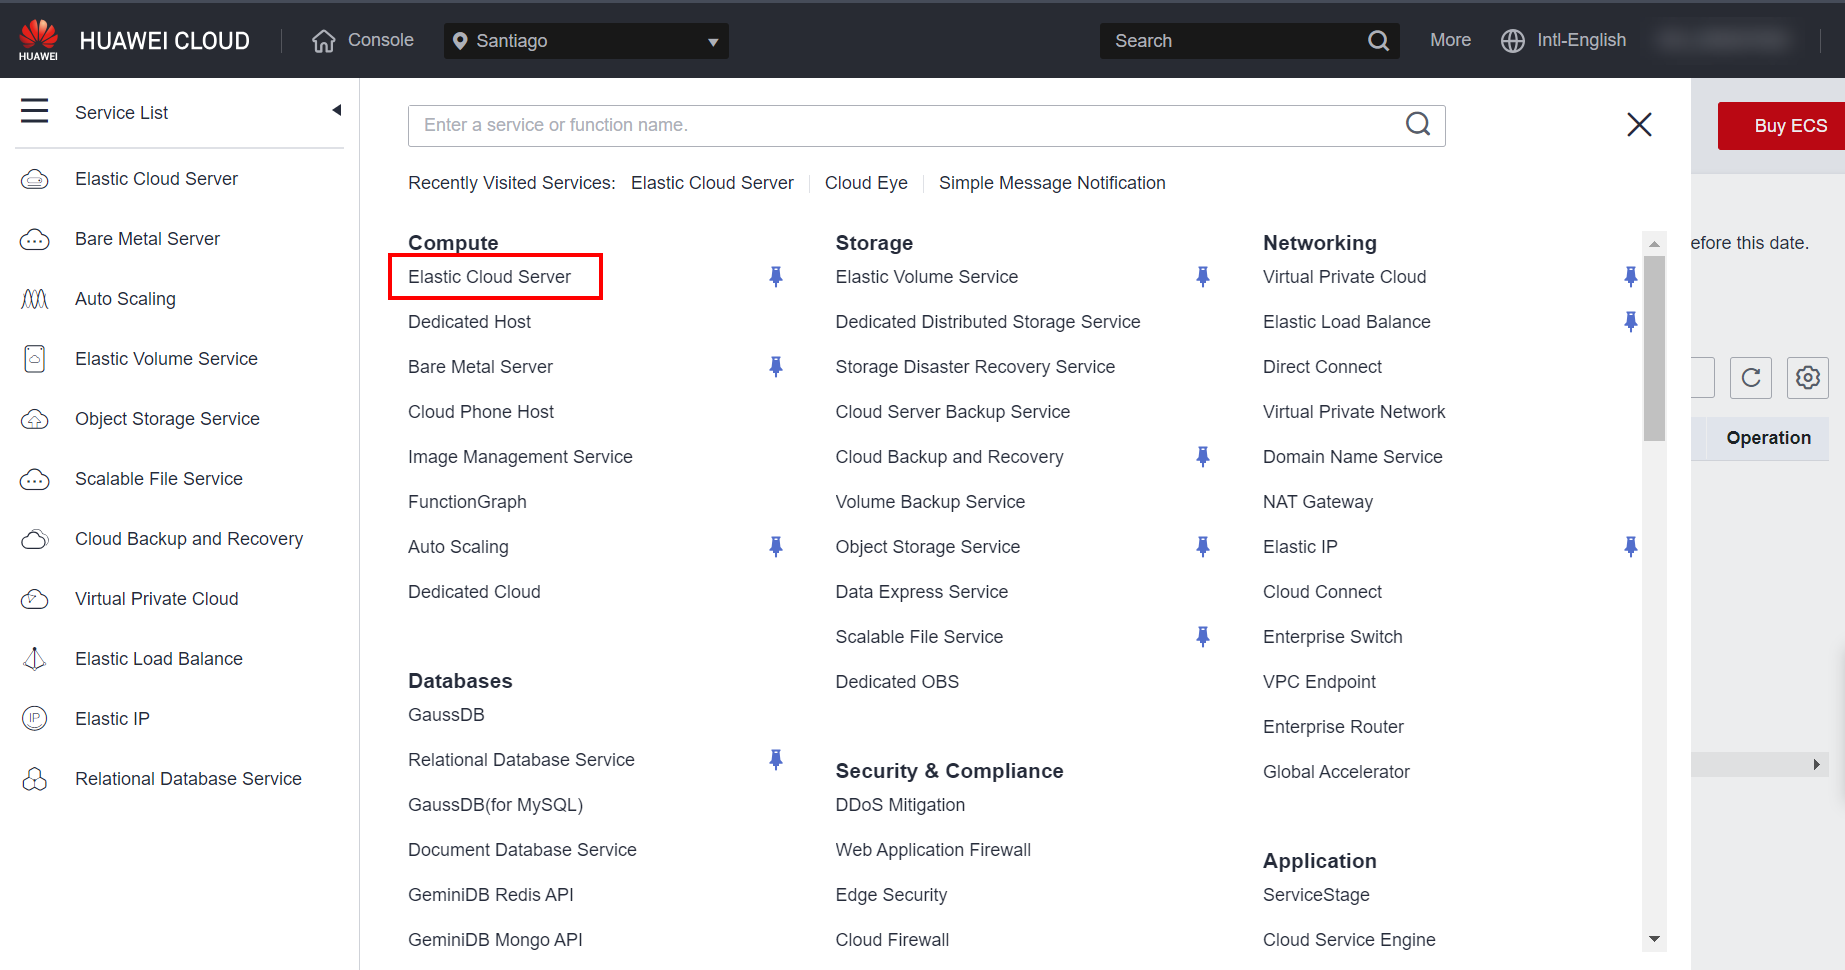
Manual:
To install the agent manually, first go to the section related to ECS or BMS, depending on the type of server on which the agent will be installed.
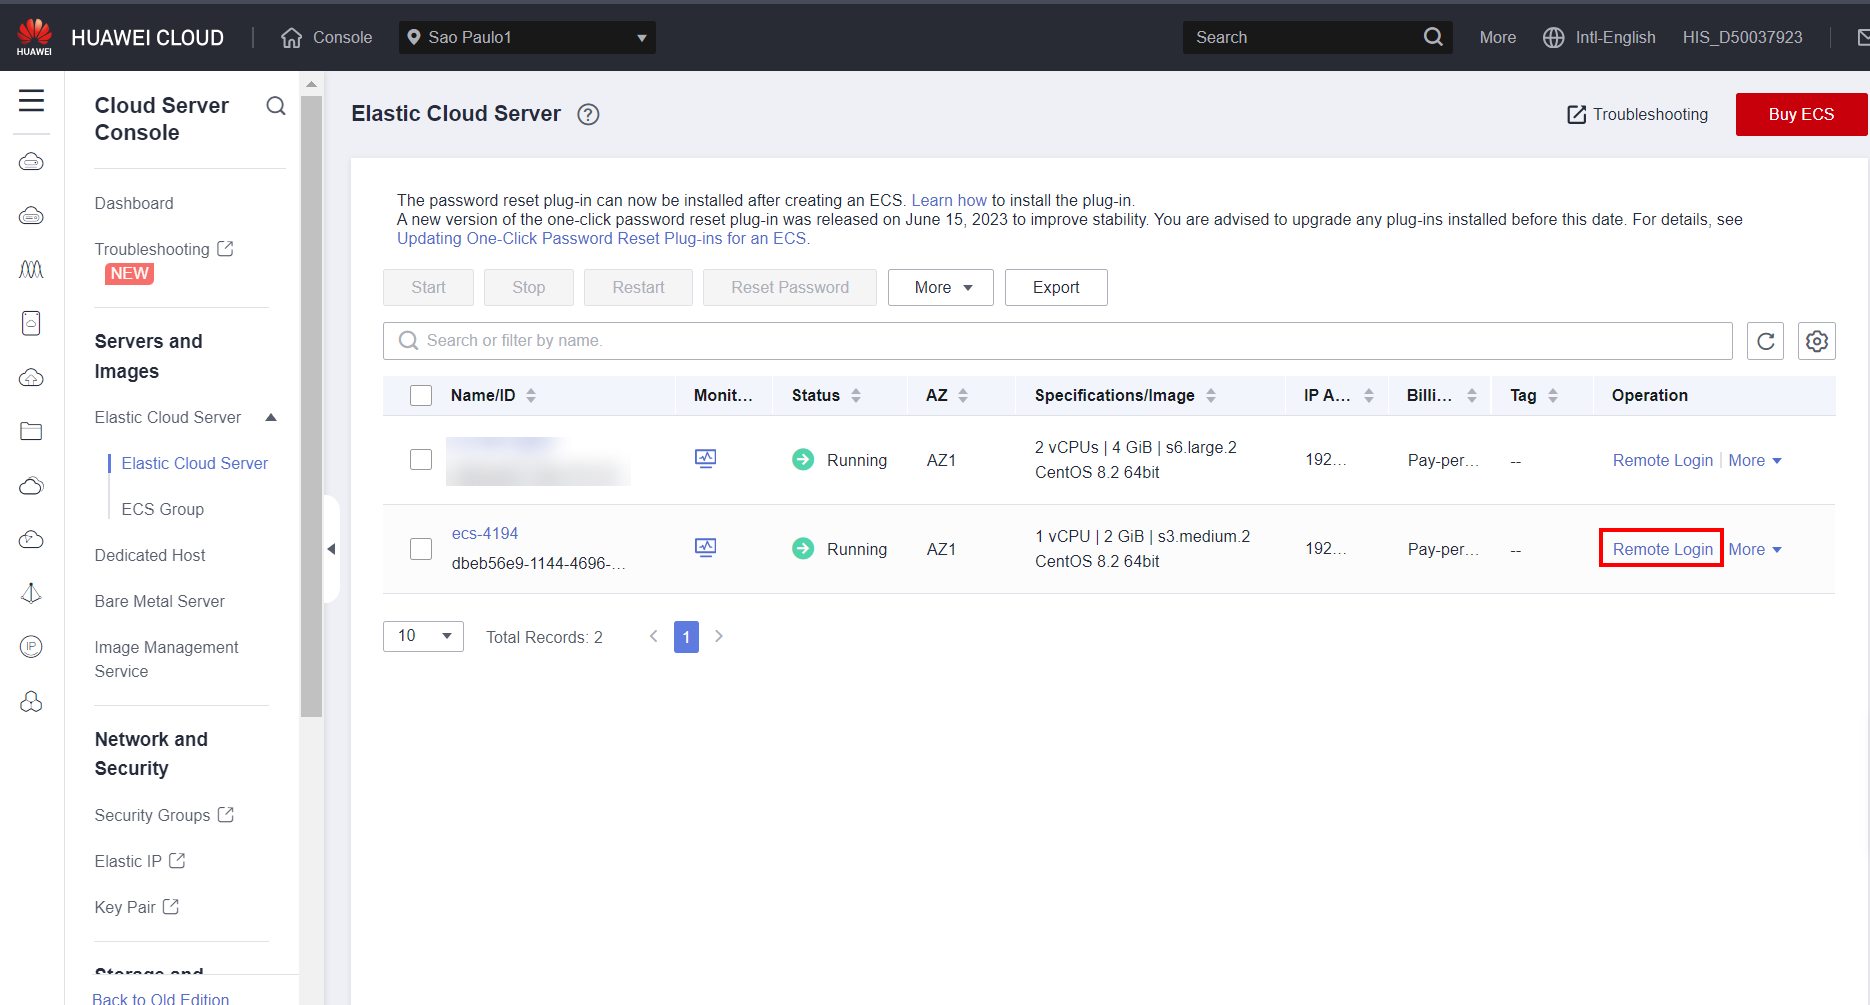
Select Remote Login to log in to the desired server
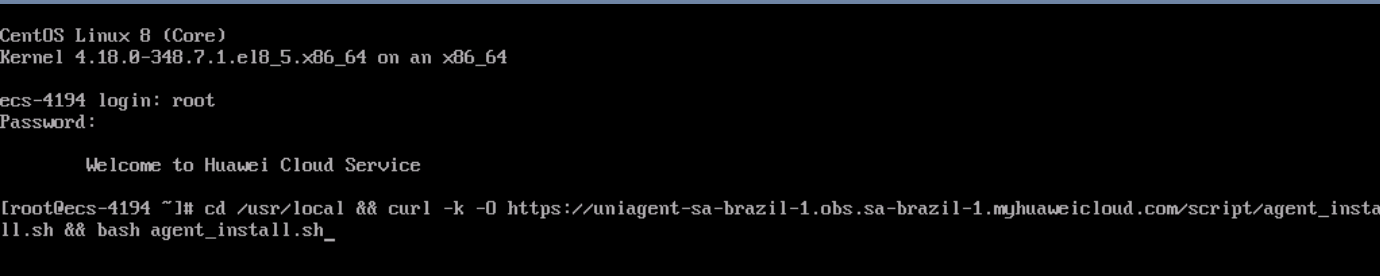
Log in to the server by entering the username and password configured when the server was created and then enter the following command, if the region where the server is located is LA-Santiago:
cd /usr/local && curl -k -O https://uniagent-la-south-2.obs.la-south-2.myhuaweicloud.com/script/agent_install.sh && bash agent_install.sh
If the region where the server is located is different from LA-Santiago, you can find the list of commands by region in the following link: https://support.huaweicloud.com/intl/en-us/usermanual-ces/ces_01_0029.html
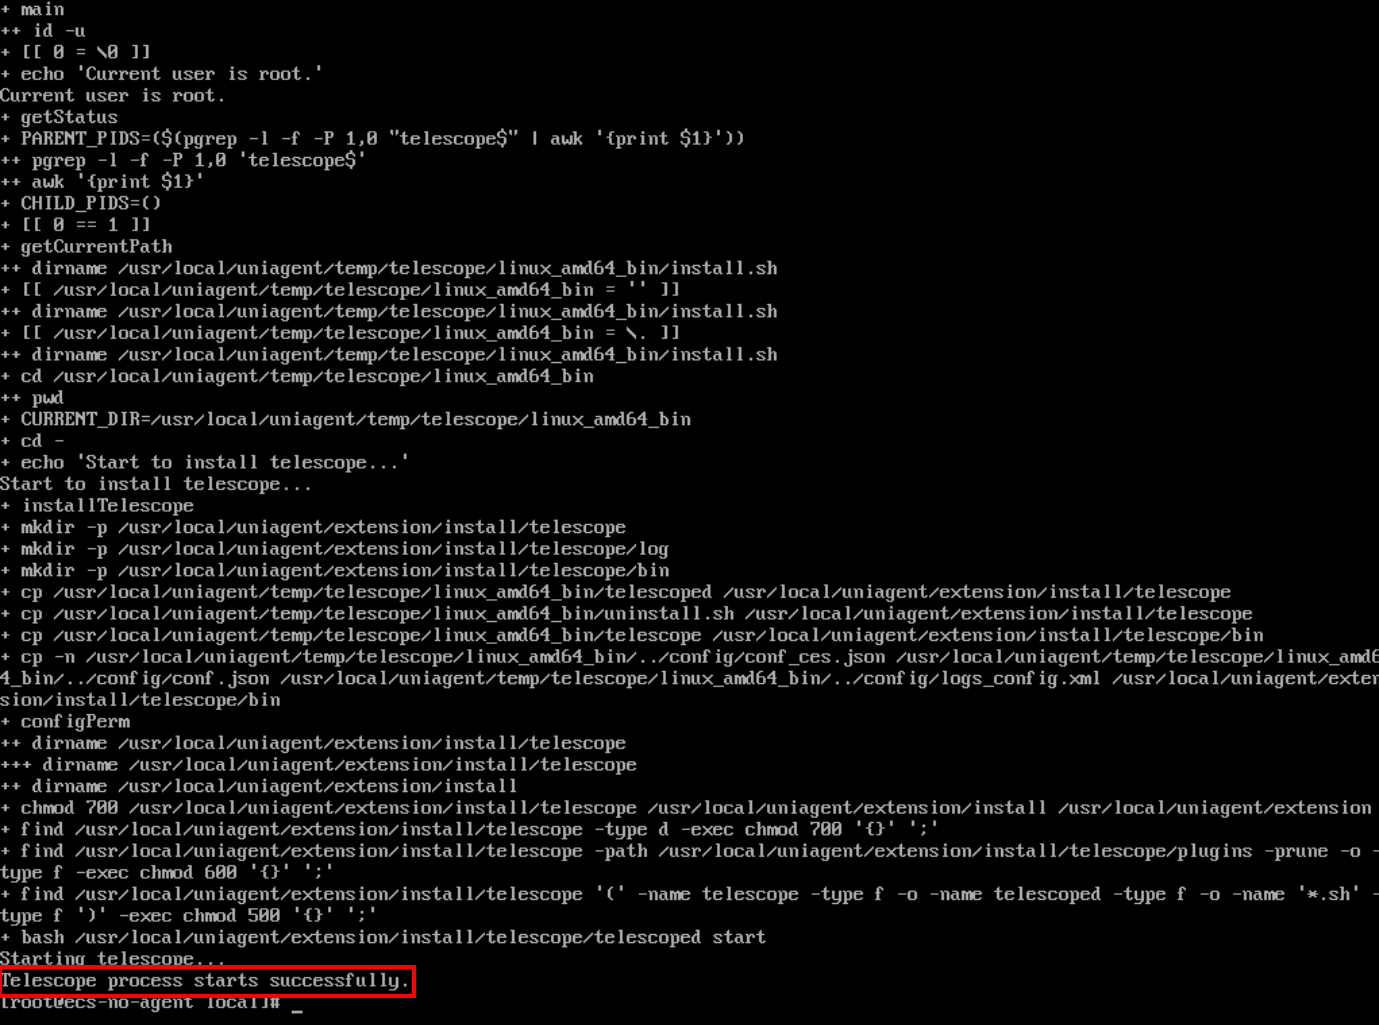
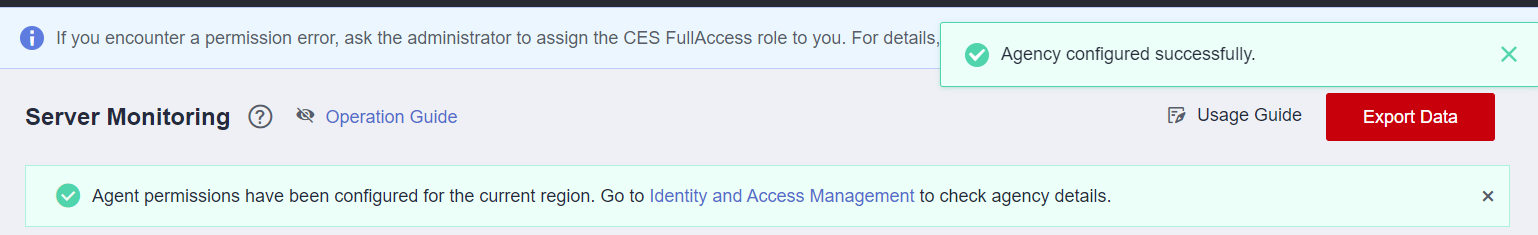
If the red message above appears at the end of the installation, the agent has been successfully installed.
Dashboard
The Dashboard section concerns the area where custom charts can be created for monitoring selected services and resources, with the chosen metrics.
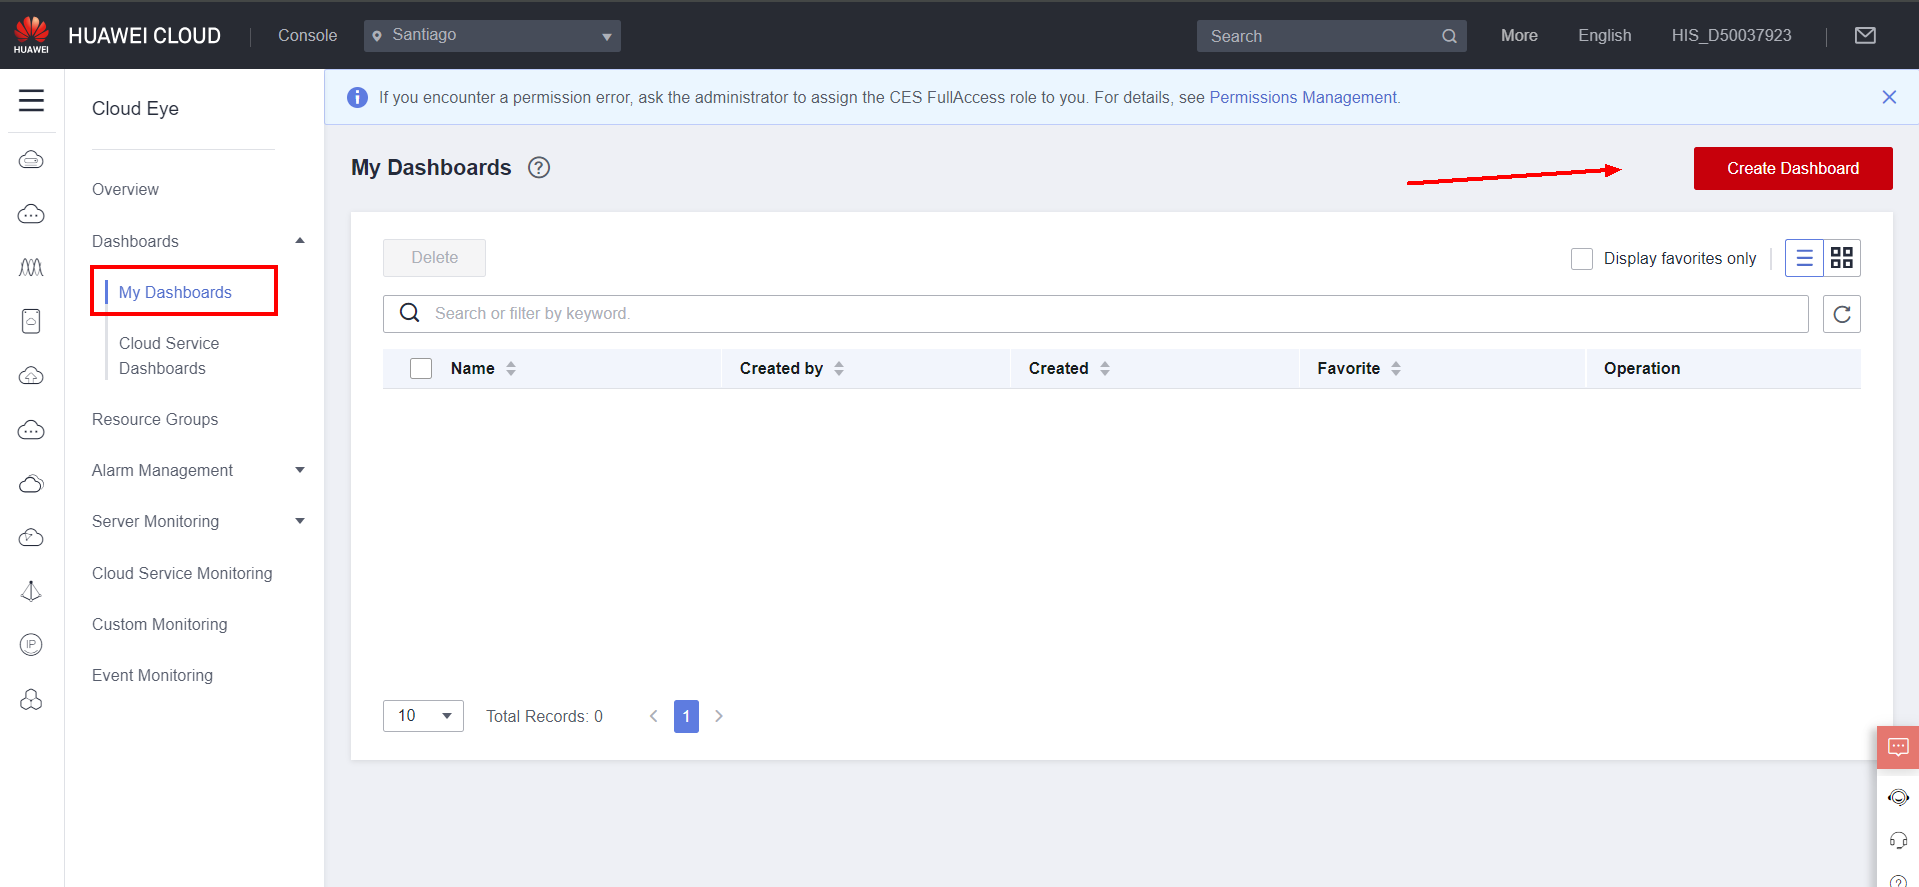
To create a dashboard, navigate to the My Dashboards section in Dashboards and click Create Dashboard.
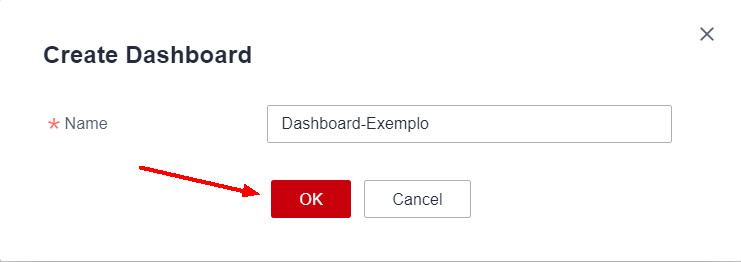
Choose a name for the dashboard in Name and click OK.
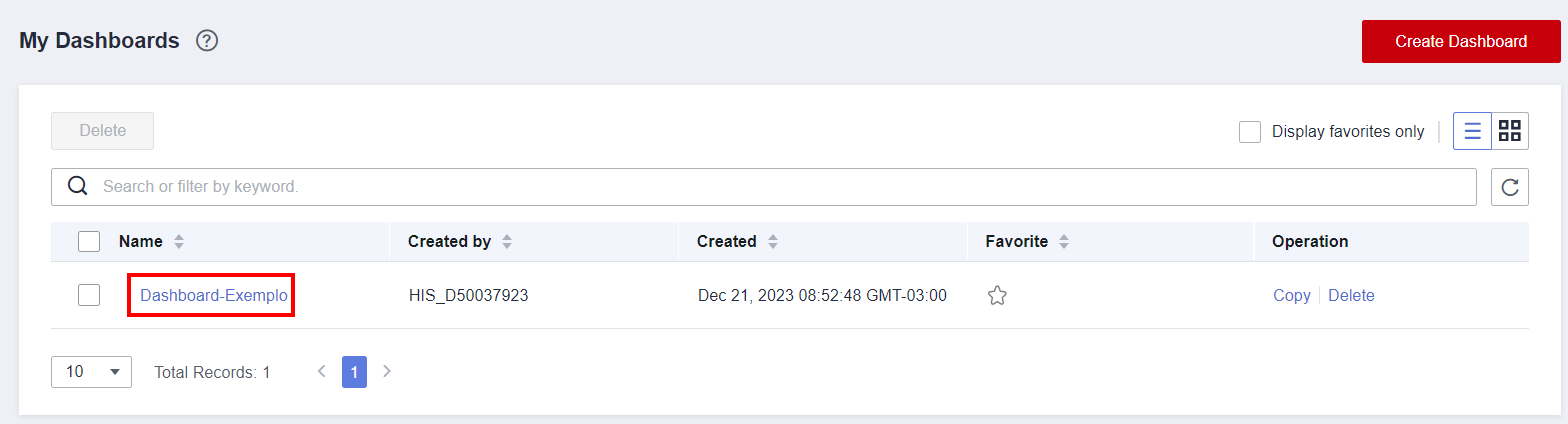
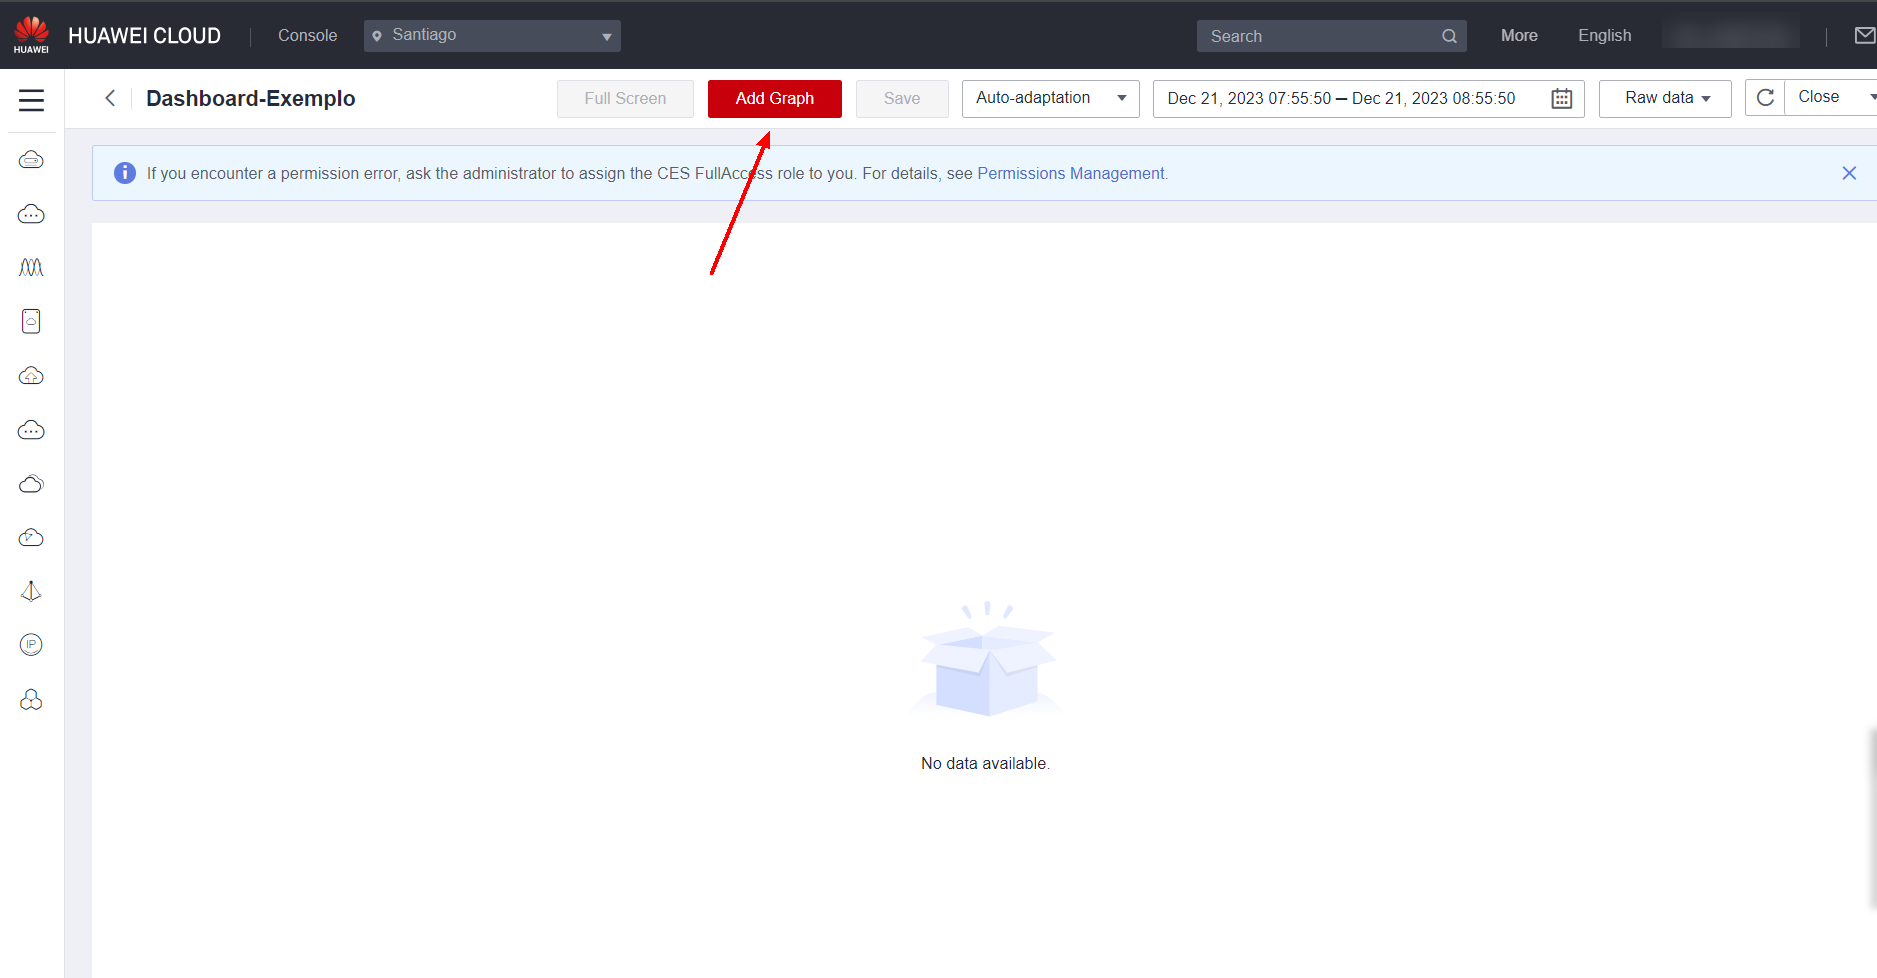
To add graphs for monitoring specific metrics, graphs can be added to dashboards. To add a graph, click on the created dashboard and click Add Graph.
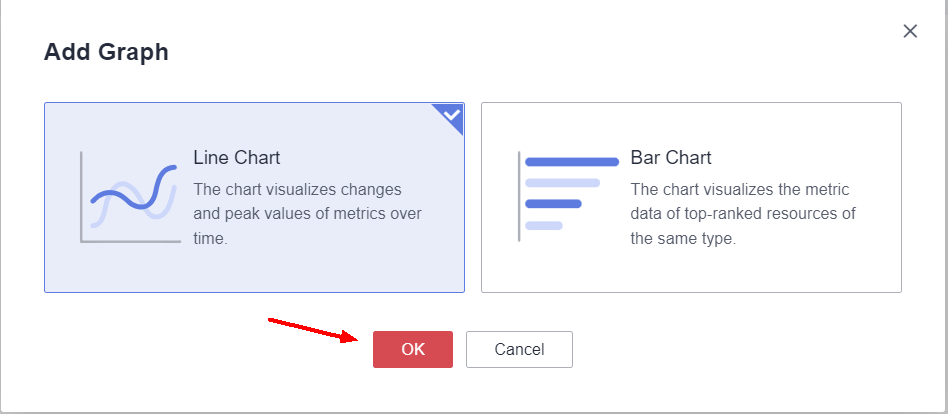
Choose the type of chart to create and click OK.
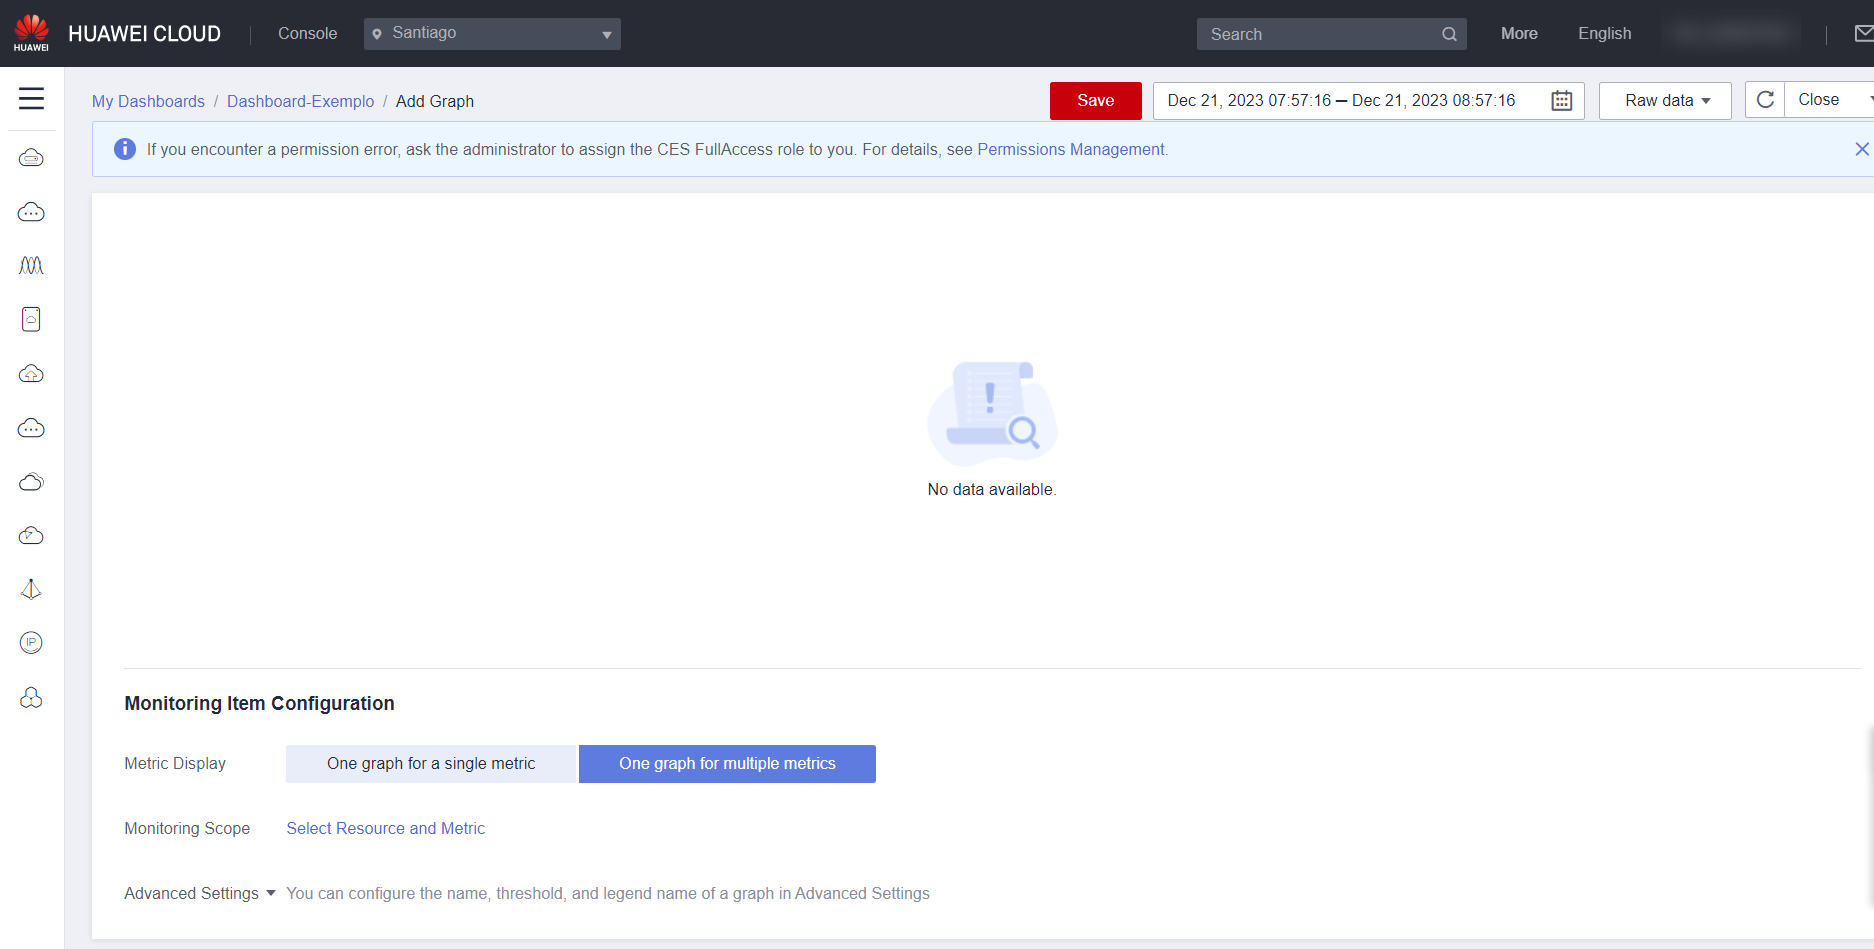
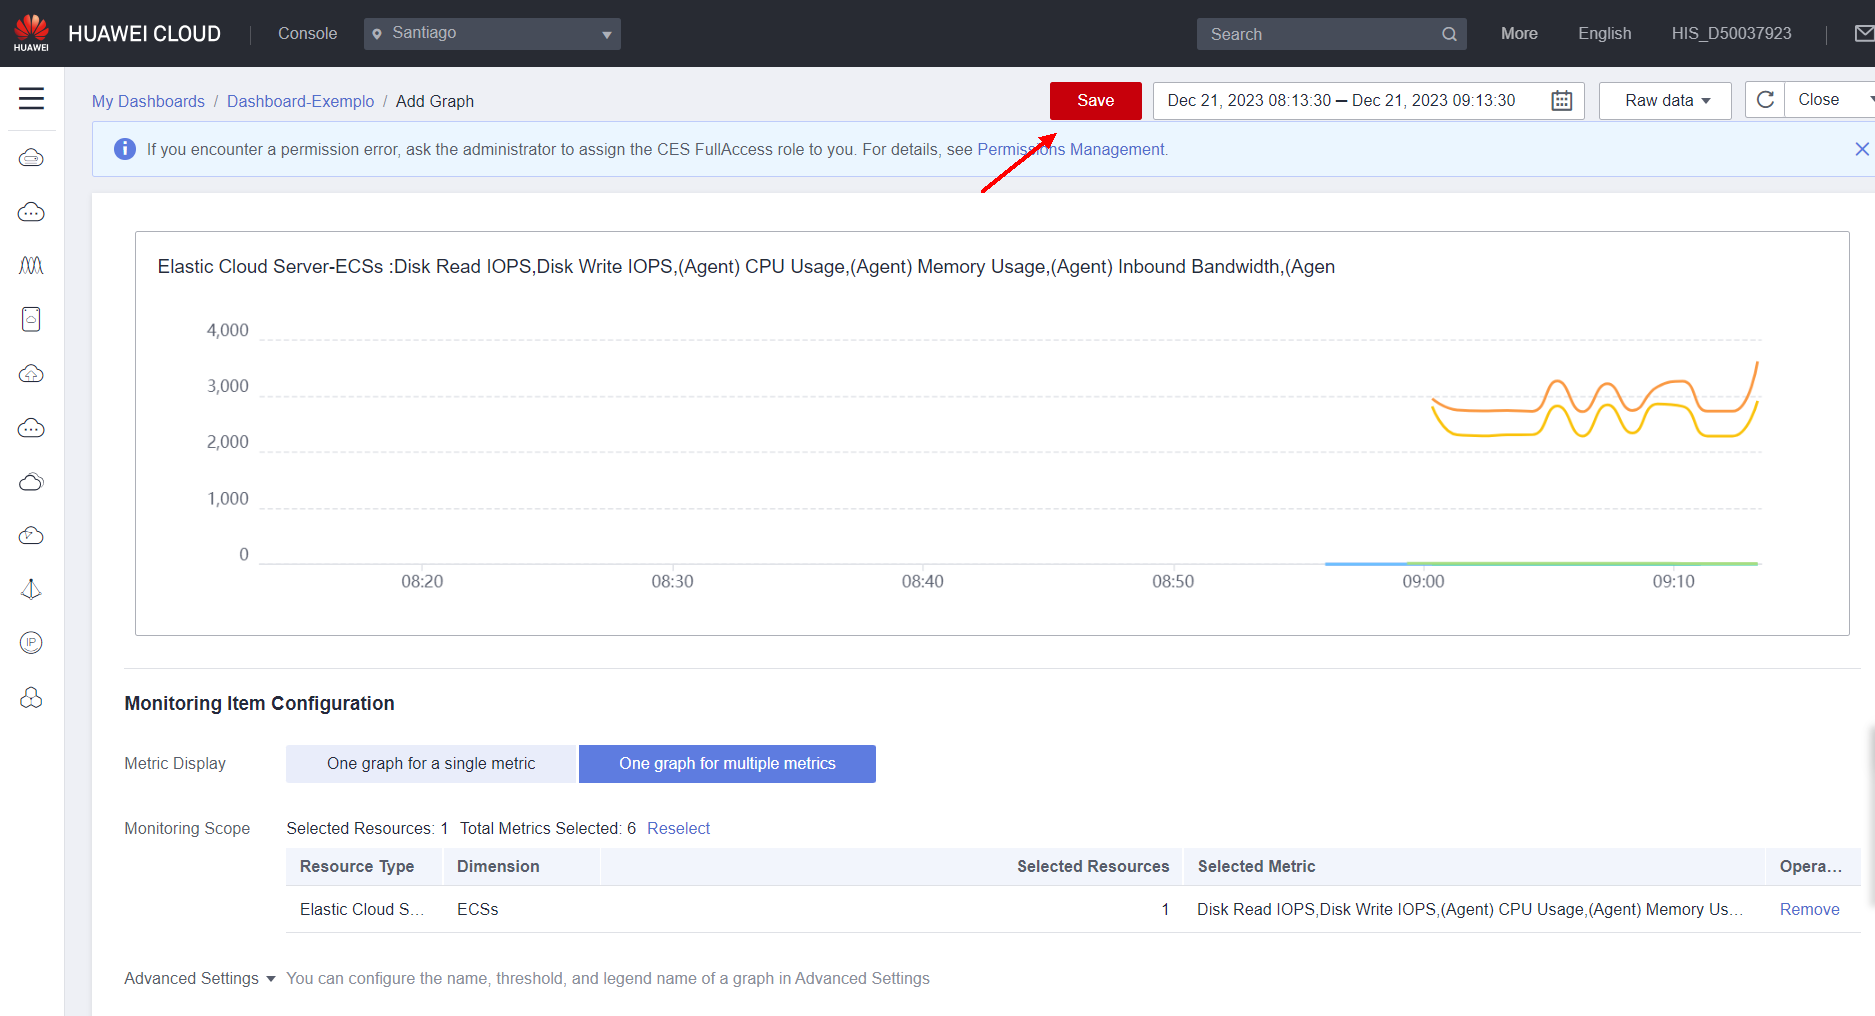
Certain settings can be made when adding a chart to a dashboard, such as whether the same chart will have multiple metrics or only one metric, the period in which the data was collected, the type of data to be displayed (raw data, maximum, minimum, average or sum) and the metrics to be displayed.
Under Metric Display, select One graph for a single metric to add a single metric to the graph, or select One graph for multiple metrics to add multiple metrics to the graph.
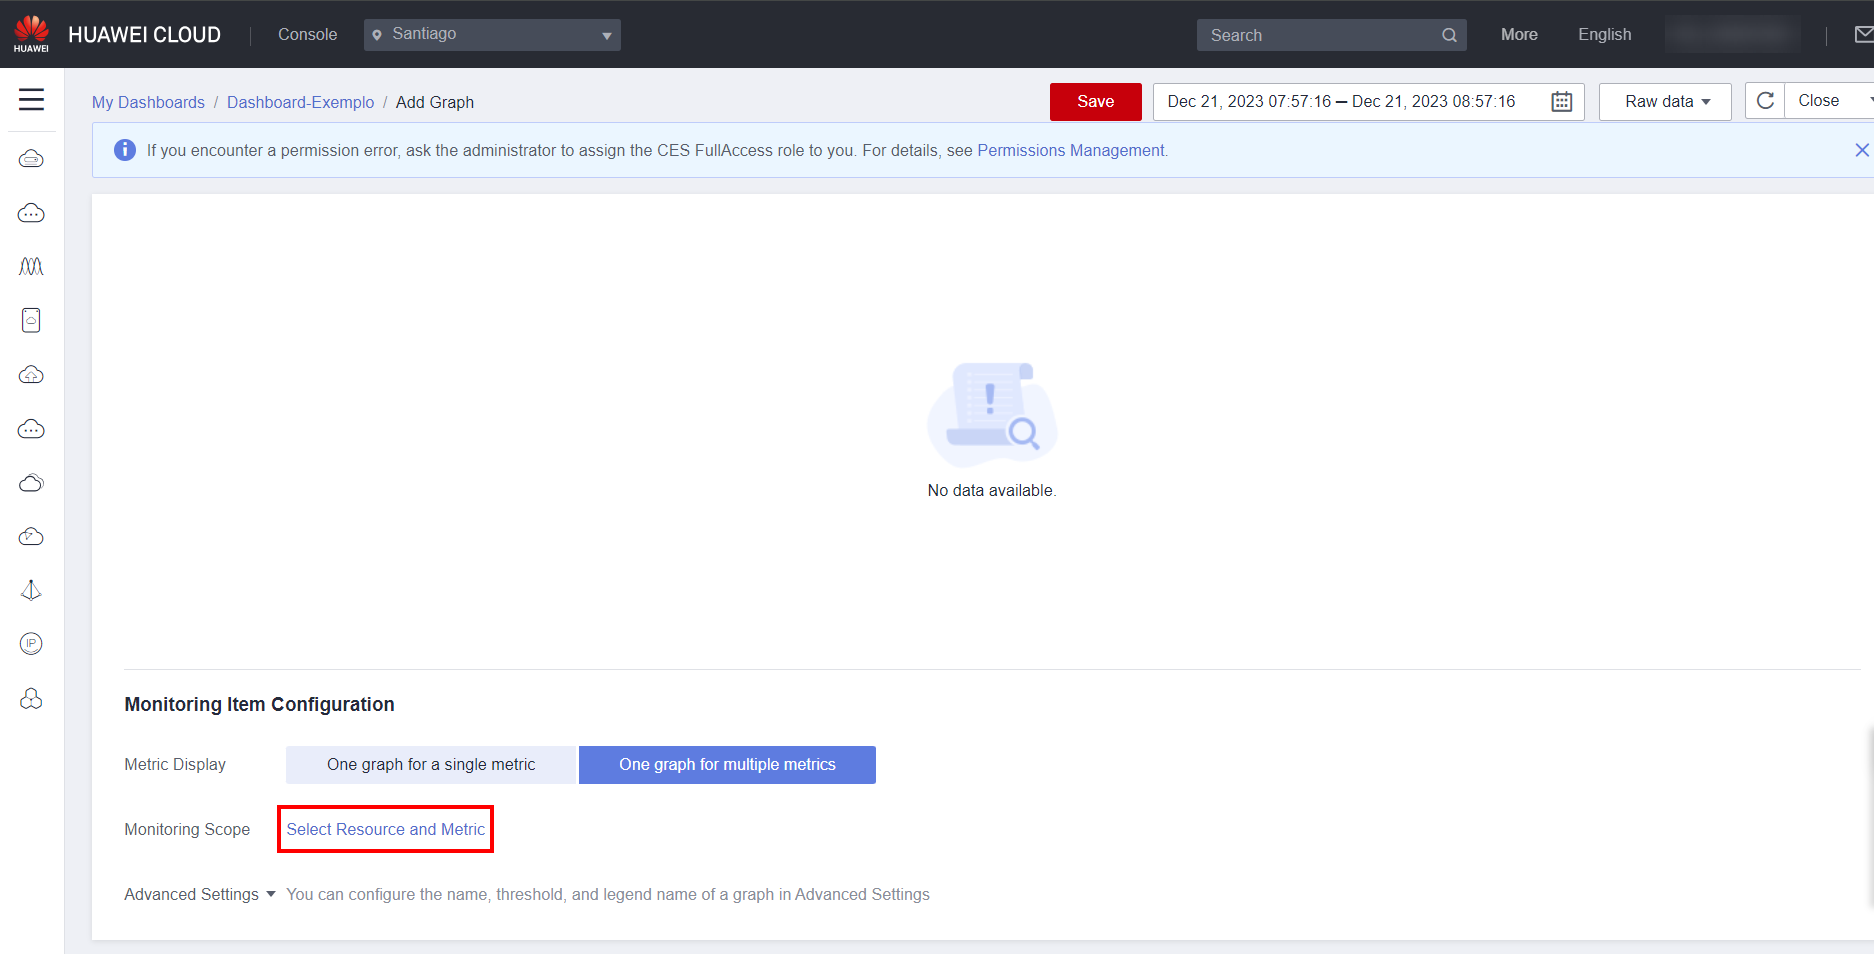
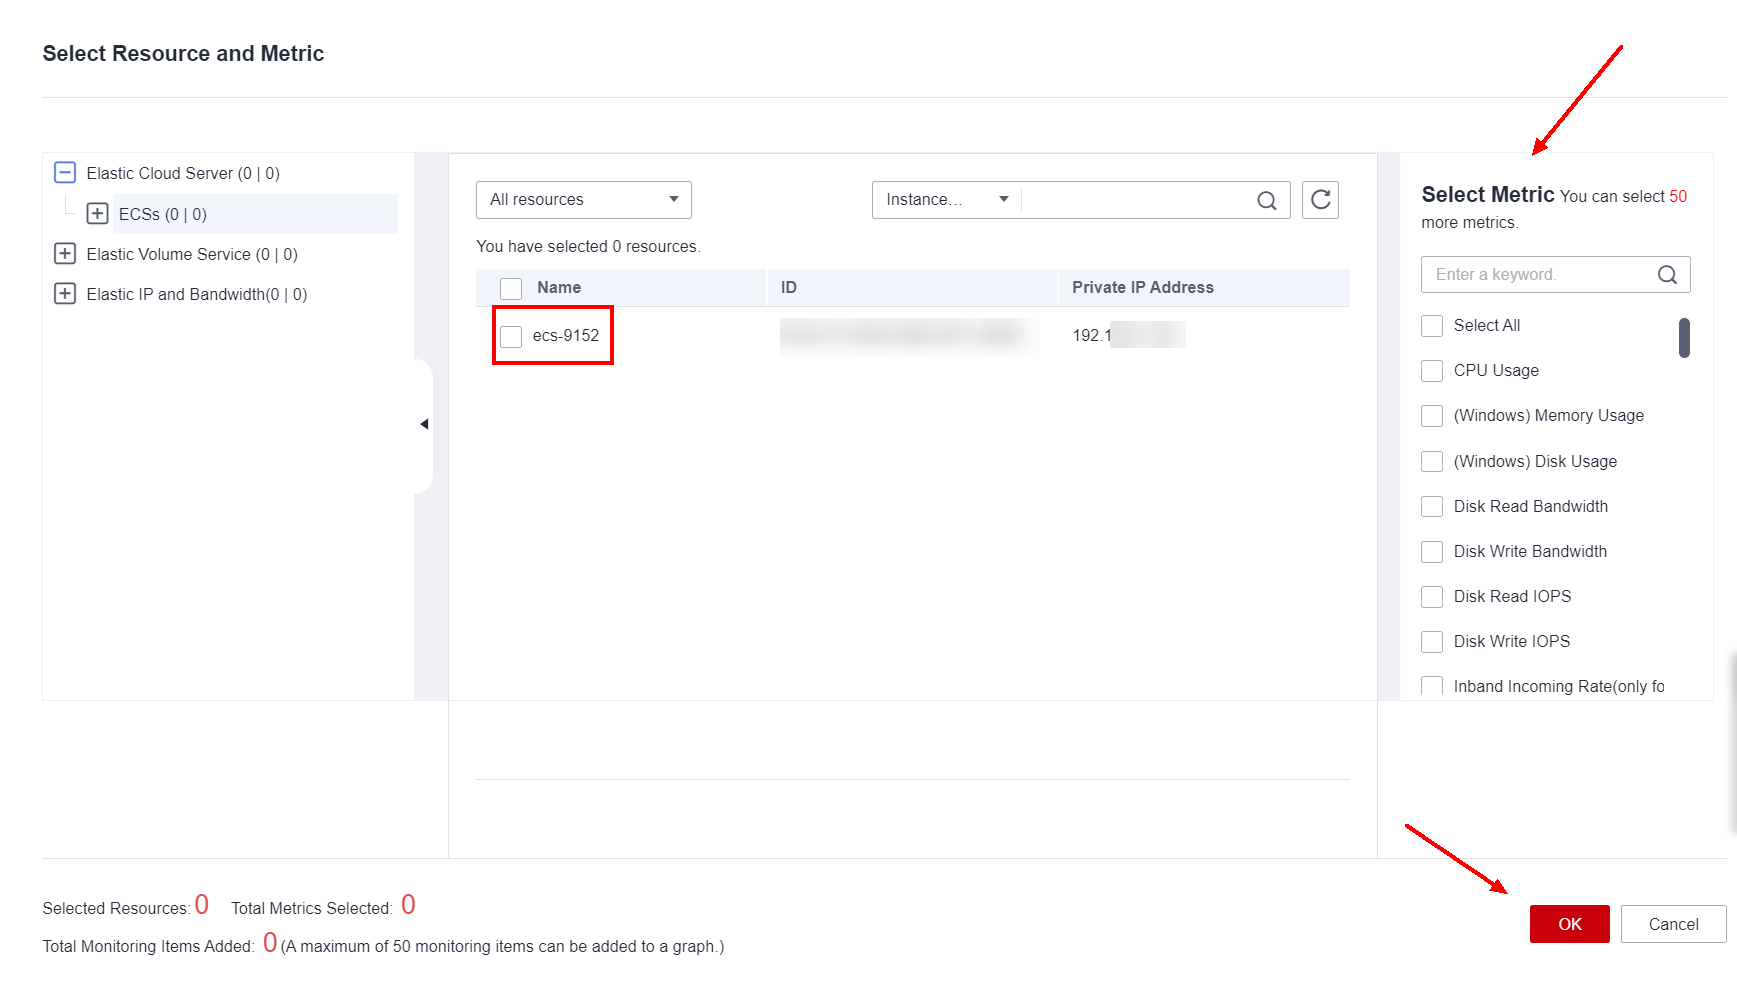
Click Select Resource and Metric to select the resource to be monitored and the metric for that resource.
Select the type of service to be monitored on the left side of the Select Resource and Metric page, the specific resource to be monitored in the middle area of the page, and the metrics for that resource on the right. In this example, CPU, disk, memory, and network usage will be monitored on “ecs-9152”.
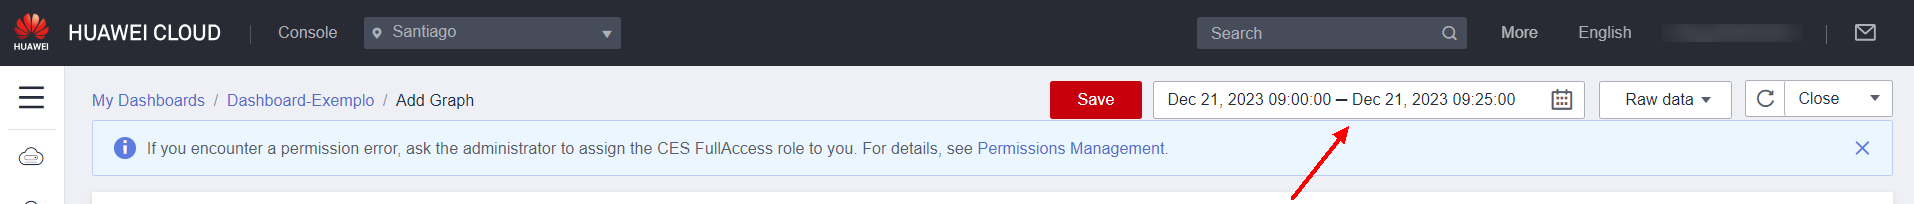
Adjust the data collection time in the upper right corner of the page Add Graph.
A sample of the generated graph will appear on the page. Click Save to confirm and add the graph to the dashboard.
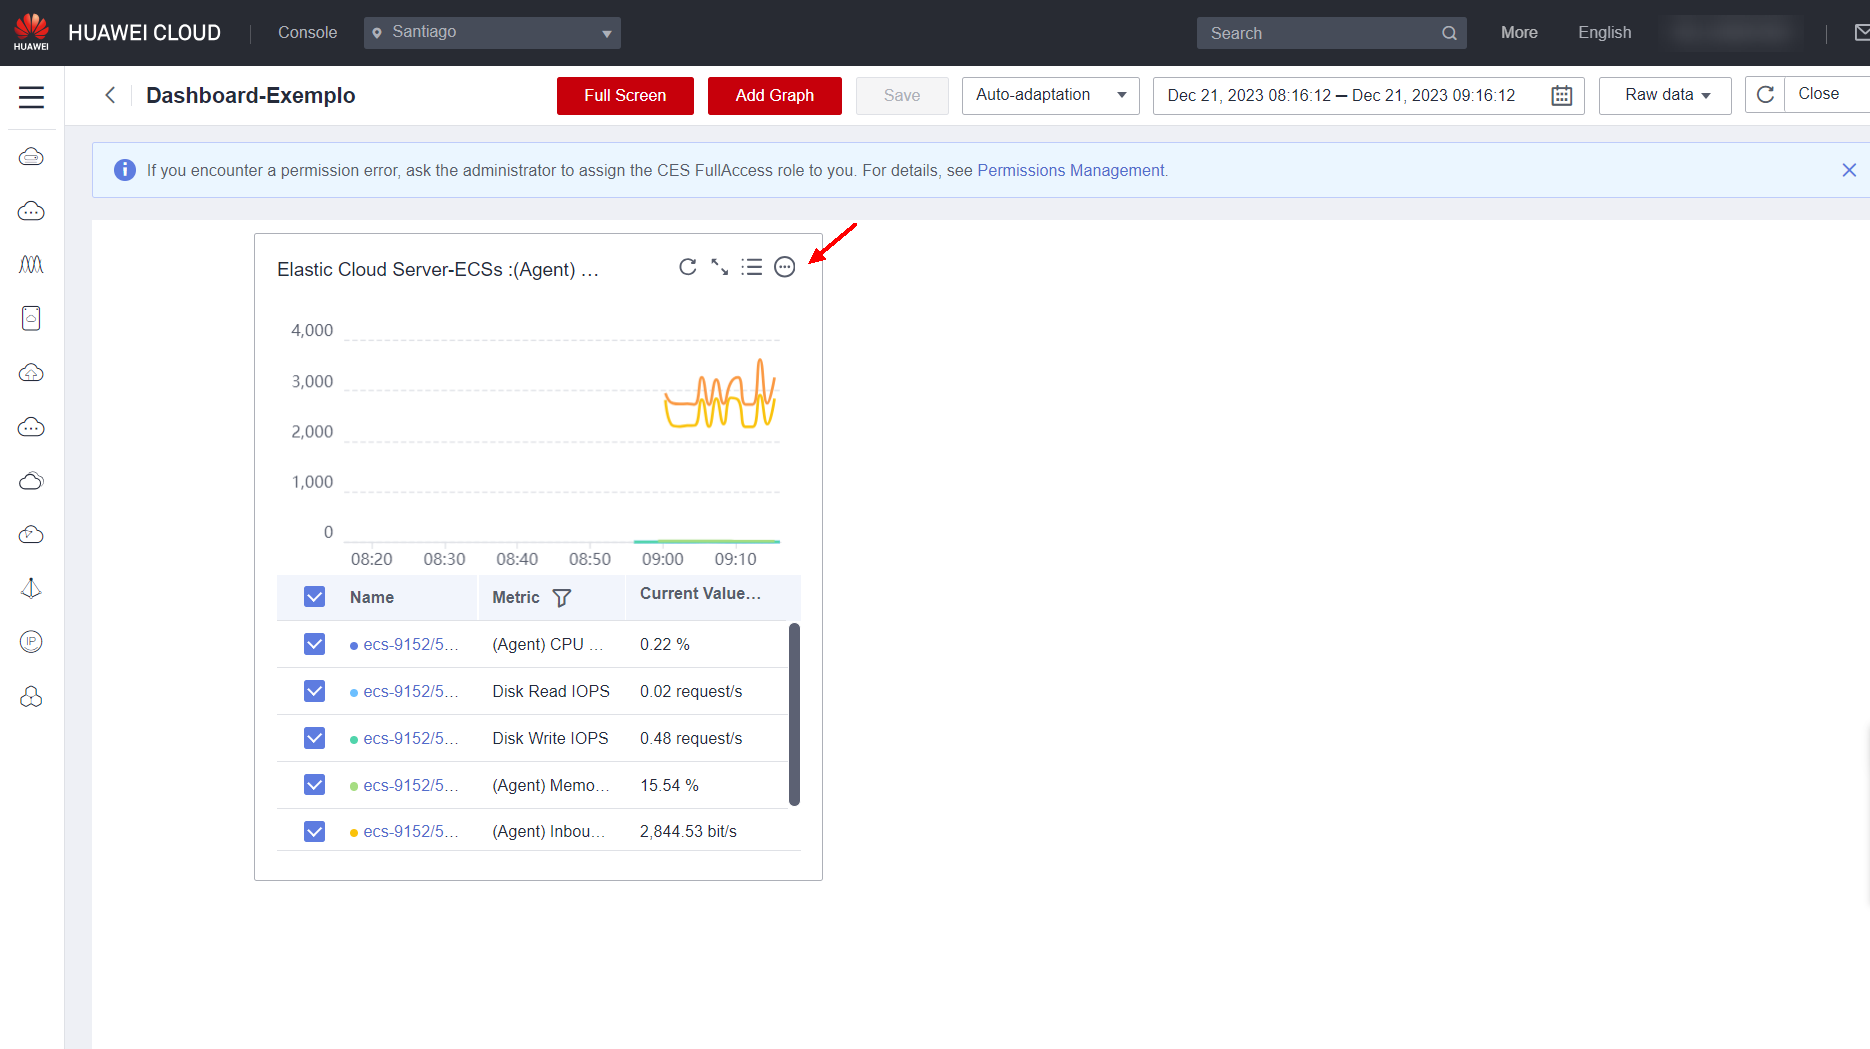
On the dashboard, you can create a legend for the graph, edit it, make it full screen, reload the data shown in the graph, and move the graph.
In Cloud Eye, you can create numerous dashboards with several graphs in each dashboard, and each graph can show multiple monitoring metrics. In addition, as described in topic 3.1, in the CES Overview section, you can have an overview of the monitored resources with the main metrics used, such as CPU, memory and disk usage on servers; network usage and a total of alarms triggered in Cloud Eye.
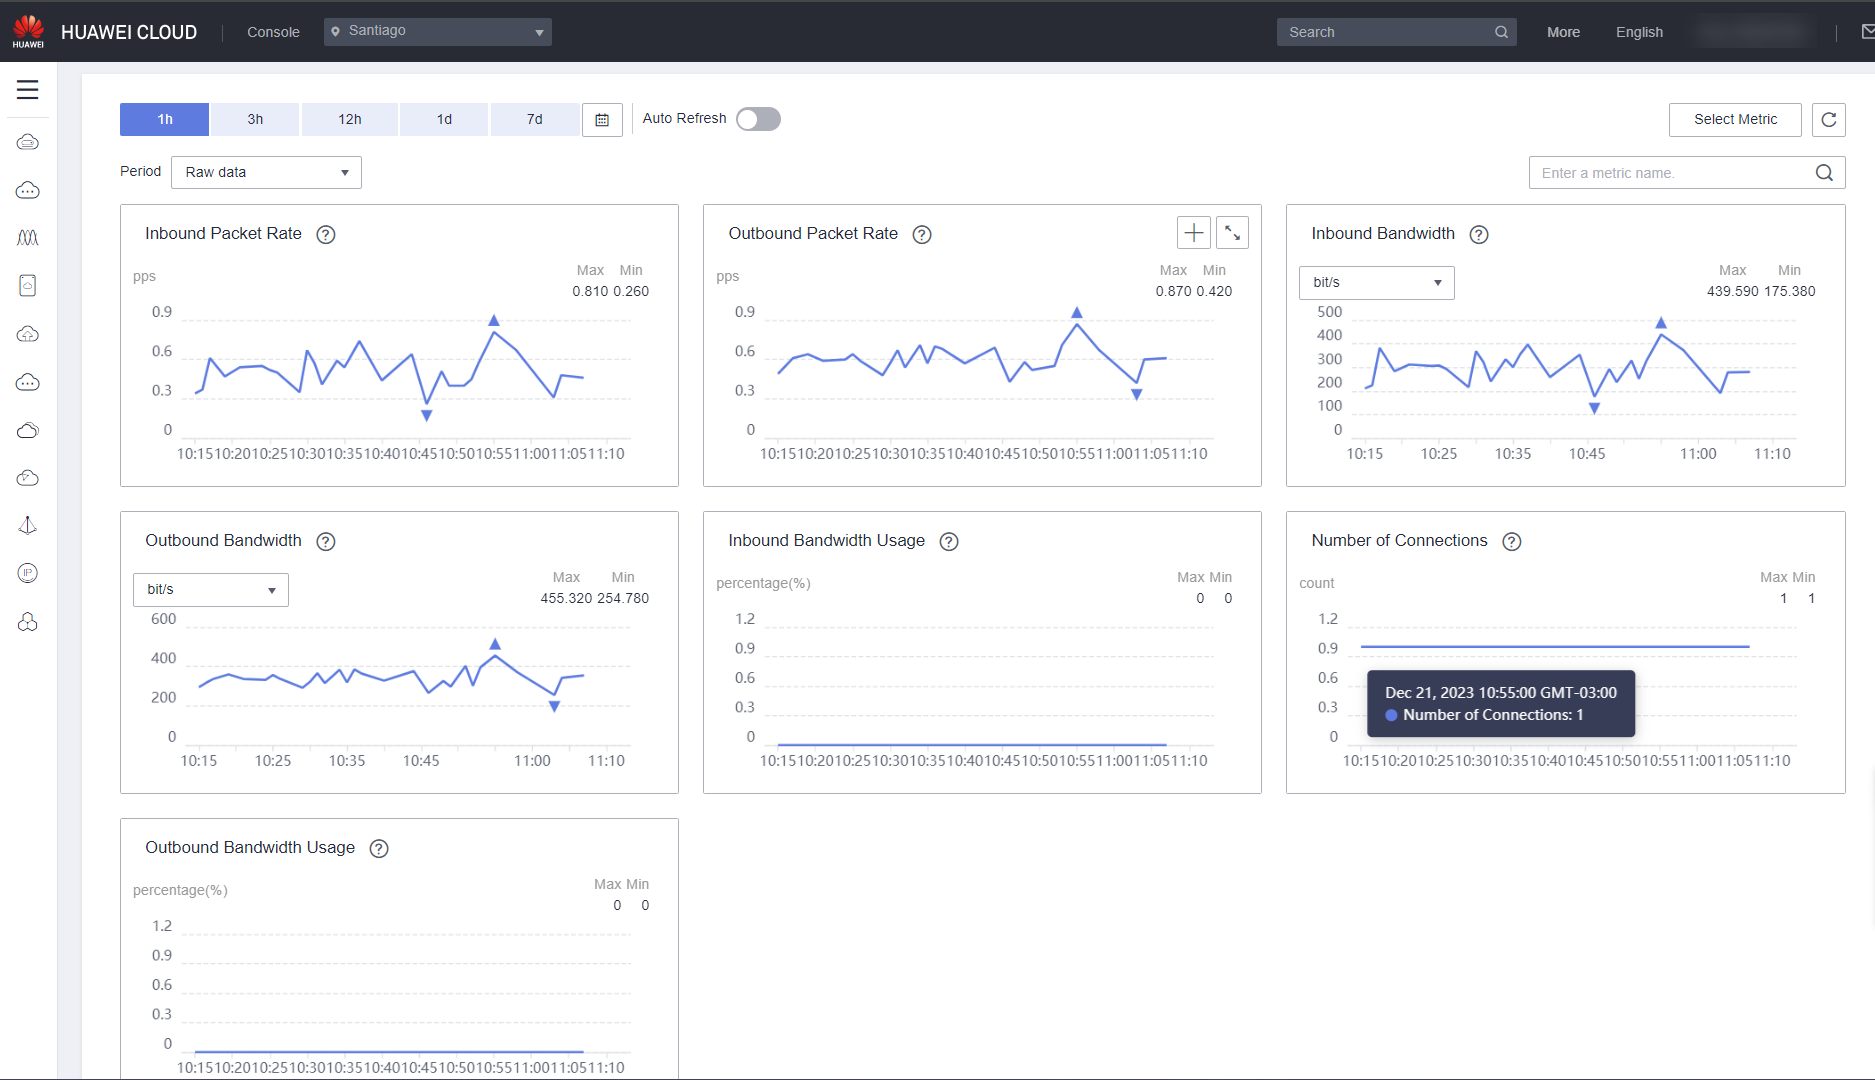
Cloud service monitoring
In the Cloud Service Monitoring section, dashboards for each resource of the ECS, EIP and bandwidth, NAT and VPN services are automatically created during the creation of these resources. The main monitoring metrics of these services are added in the form of a graph in this section for quick and general monitoring of these services.
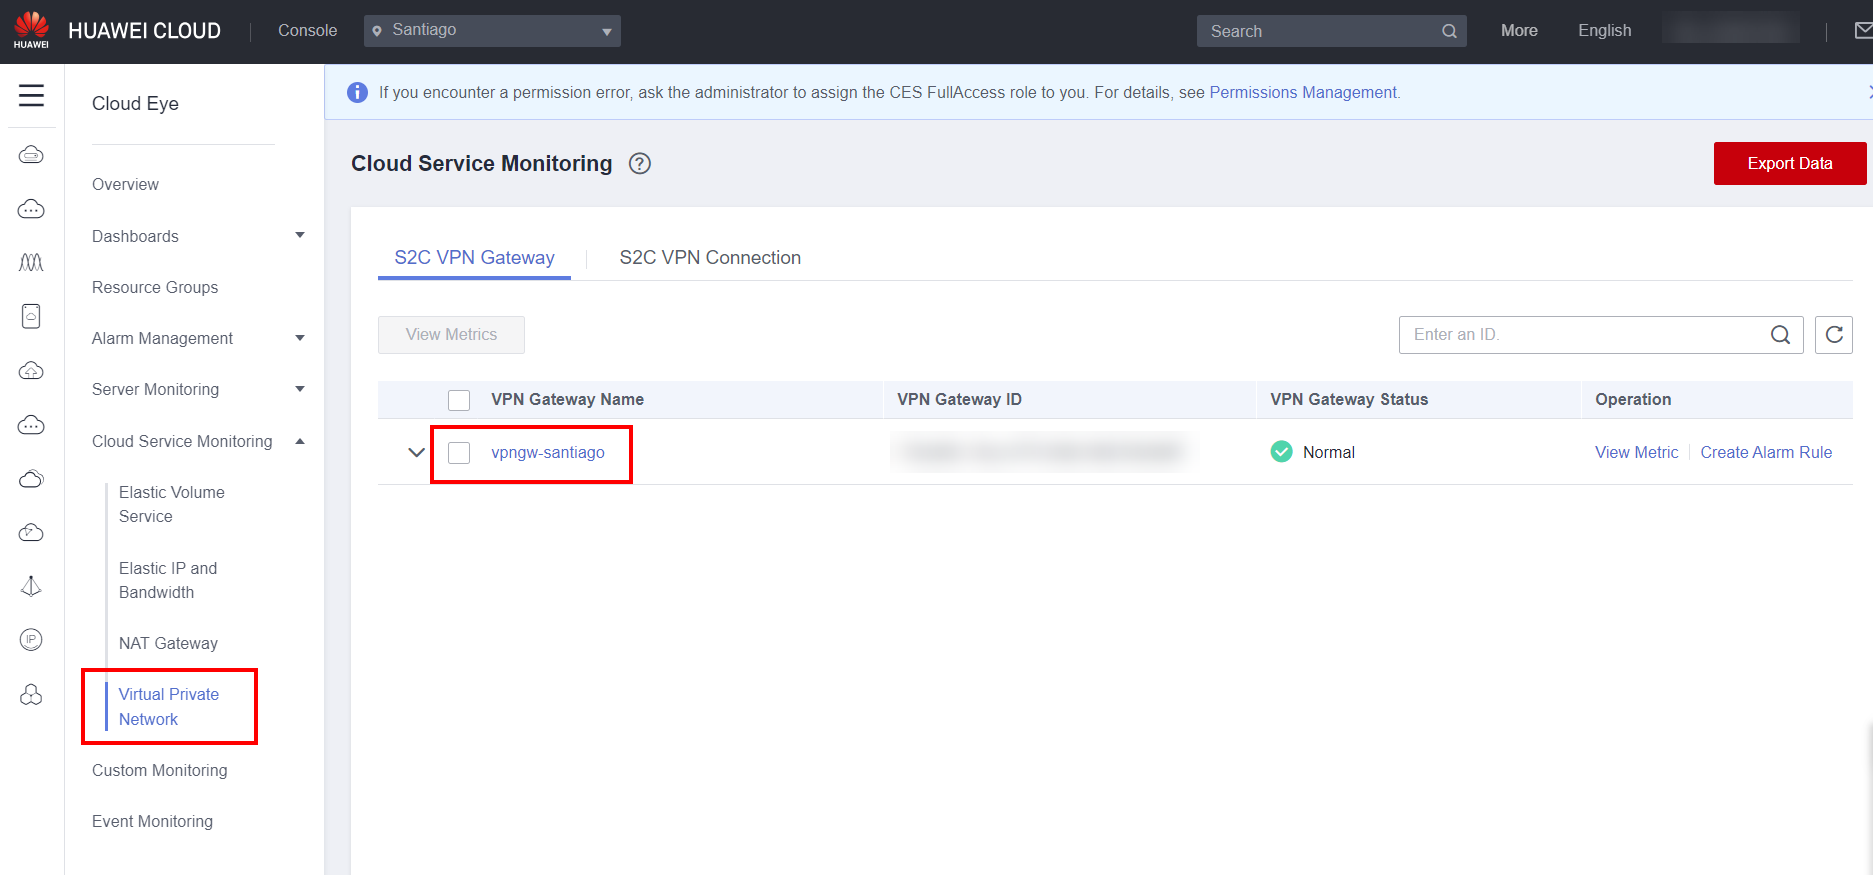
In addition to viewing the graphs related to the main monitored metrics, it is also possible to export the collected data by clicking the Export Data button.
Attachments
Server Monitoring Metrics
| Metrics | Agentless | Agent Installed |
|---|---|---|
| CPU Usage | Yes | Yes / Dedicated |
| Disk Usage | Yes | Yes |
| Memory Usage | Yes | Yes / Dedicated |
| Disk Write Bandwidth | Yes | Yes |
| Disk Read Bandwidth | Yes | Yes |
| Disk Write IOPS | Yes | Yes |
| Disk Read IOPS | Yes | Yes |
| Bandwidth Input Rate | Yes | Yes |
| In-band egress rate | Yes | Yes |
| Out-of-band egress rate | Yes | Yes |
| Out-of-band egress rate | Yes | Yes |
| CPU credit usage | Yes | Yes |
| CPU credit balancing | Yes | Yes |
| CPU credit balancing surplus | Yes | Yes |
| CPU credit loaded surplus | Yes | Yes |
| Network connections | Yes | Yes |
| Inbound bandwidth per server | Yes | Yes |
| Outbound bandwidth per server | Yes | Yes |
| Inbound PPS | Yes | Yes |
| Outbound PPS | Yes | Yes |
| New connections | Yes | Yes |
| Aggregate ECC uncorrectable errors | Yes | Yes |
| Pages retired with single bit errors | Yes | Yes |
| Pages retired with double bit errors | Yes | Yes |
| GPU health status | Yes | Yes |
| GPU encoder usage | Yes | Yes |
| GPU decoder usage | Yes | Yes |
| ECC volatile correctable errors | Yes | Yes |
| ECC volatile uncorrectable errors | Yes | Yes |
| Idle CPU | No | Yes / Dedicated |
| User space CPU usage | No | Yes / Dedicated |
| Kernel space CPU usage | No | Yes / Dedicated |
| Other processes CPU usage | No | Yes / Dedicated |
| Optimal processes CPU usage | No | Yes / Dedicated |
| Time CPU is waiting for I/O operations | No | Yes / Dedicated |
| CPU interrupt time | No | Yes / Dedicated |
| Software CPU interrupt time | No | Yes / Dedicated |
| Available memory | No | Yes / Dedicated |
| Idle memory | No | Yes / Dedicated |
| Buffer | No | Yes / Dedicated |
| Cache | No | Yes / Dedicated |
| Inbound bandwidth per NIC | No | Yes / Dedicated |
| Outbound bandwidth per NIC | No | Yes / Dedicated |
| Packet rate sent per NIC | No | Yes / Dedicated |
| Packet rate received per NIC | No | Yes / Dedicated |
| Packet rate with error received per NIC | No | Yes / Dedicated |
| Packet rate with error transmitted per NIC | No | Yes / Dedicated |
| Packet rate received dropped per NIC | No | Yes / Dedicated |
| Packet rate transmitted dropped per NIC | No | Yes / Dedicated |
| Processes running | No | Yes / Dedicated |
| Idle processes | No | Yes / Dedicated |
| Zombie processes | No | Yes / Dedicated |
| Blocked processes | No | Yes / Dedicated |
| Sleeping processes | No | Yes / Dedicated |
| Total processes | No | Yes / Dedicated |
| TCP retransmission rate | No | Yes / Dedicated |
| TCP SYS_SENT | No | Yes / Dedicated |
| TCP SYS_RECV | No | Yes / Dedicated |
| TCP FIN_WAIT1 | No | Yes / Dedicated |
| TCP FIN_WAIT2 | No | Yes / Dedicated |
| TCP CLOSE | No | Yes / Dedicated |
| TCP LAST_ACK | No | Yes / Dedicated |
| TCP LISTEN | No | Yes / Dedicated |
| TCP CLOSING | No | Yes / Dedicated |
| Average CPU load in the last minute | No | Yes / Dedicated |
| Average CPU load in the last 15 minutes | No | Yes / Dedicated |
| Average CPU load in the last 5 minutes | No | Yes / Dedicated |
| TCP ESTABLISHED | No | Yes / Dedicated |
| TCP TOTAL | No | Yes / Dedicated |
| UDP TOTAL | No | Yes / Dedicated |
| NTP Offset | No | Yes / Dedicated |
| Total files processed | No | Yes / Dedicated |
VPN Gateway Monitoring Metrics
| Metrics | Supported |
|---|---|
| Inbound Packet Rate | Yes |
| Outbound Packet Rate | Yes |
| Inbound Bandwidth | Yes |
| Outbound Bandwidth | Yes |
| Inbound Bandwidth Usage | Yes |
| Number of Connections | Yes |
| Outbound Bandwidth Usage | Yes |
VPN Connection Monitoring Metrics
| Metrics | Supported |
|---|---|
| Tunnel Average RTT | Yes |
| Tunnel Max RTT | Yes |
| Tunnel Packet Loss Rate | Yes |
| Link Average RTT | Yes |
| Link Max RTT | Yes |
| Link Packet Loss Rate | Yes |
| VPN Connection Status | Yes |
| Packet Receive Rate | Yes |
| Packet Send Rate | Yes |
| Traffic Receive Rate | Yes |
| Traffic Send Rate | Yes |
| SA Packet Send Rate | Yes |
| SA Packet Receive Rate | Yes |
| SA Traffic Send Rate | Yes |
| SA Traffic Receive Rate | Yes |
NAT Monitoring Metrics
| Metrics | Supported |
|---|---|
| SNAT Connections | Yes |
| Inbound Bandwidth | Yes |
| Outbound Bandwidth | Yes |
| Inbound PPS | Yes |
| Outbound PPS | Yes |
| Inbound Traffic | Yes |
| Outbound Traffic | Yes |
| SNAT Connection Usage Rate | Yes |
| Ingress bandwidth usage rate | Yes |
| Egress bandwidth usage rate | Yes |
| Total egress bandwidth (UDP) | Yes |
| Total egress bandwidth (TCP) | Yes |
| Total ingress bandwidth (UDP) | Yes |
| Total ingress bandwidth (TCP) | Yes |
| Packets lost due to excessive SNAT connections | Yes |
| Packets lost due to excessive PPS | Yes |
| Packets lost by all allocated EIP ports | Yes |
References
- CES documentation: https://support.huaweicloud.com/intl/en-us/function-ces/index.html
- CES limitations: https://support.huaweicloud.com/intl/en-us/productdesc-ces/ces_07_0007.html
- FAQ: https://support.huaweicloud.com/intl/en-us/ces_faq/ces_faq_0059.html
- CES agent batch installation: https://support.huaweicloud.com/intl/en-us/usermanual-ces/ces_01_0033.html